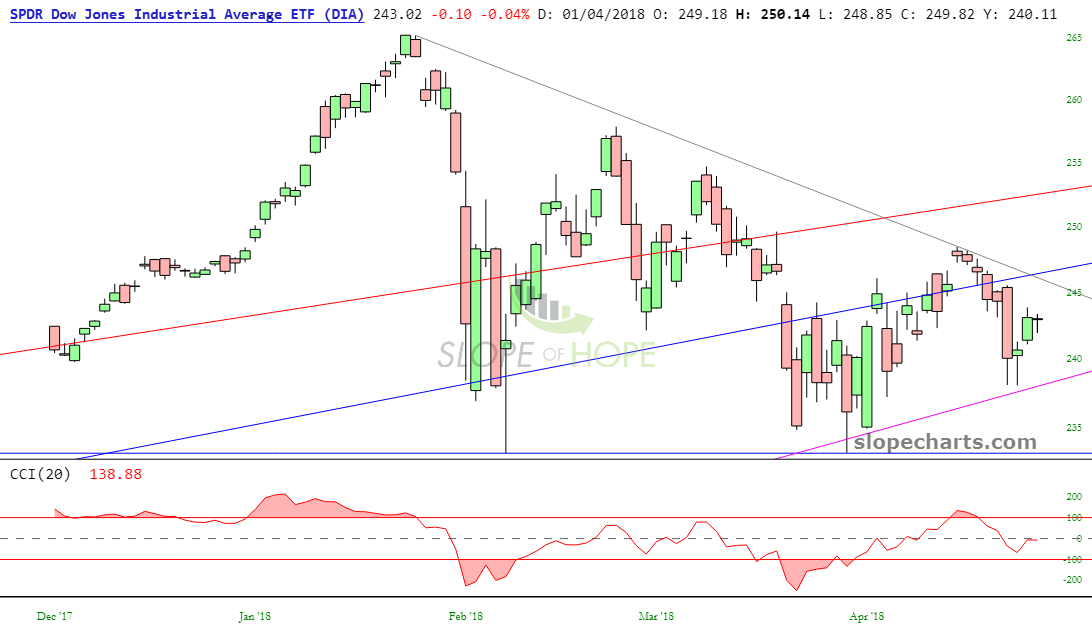
What a strange week we just finished. Pretty much all the excitement was experienced on Tuesday (I don’t even remember what caused the plunge, not that it matters), and then we had the NASDAQ-earnings-are-great rally starting on Wednesday. All in all, the week was kind of a wash, and you can see with the DIA below how the CCI is just kind of meandering at the midline.
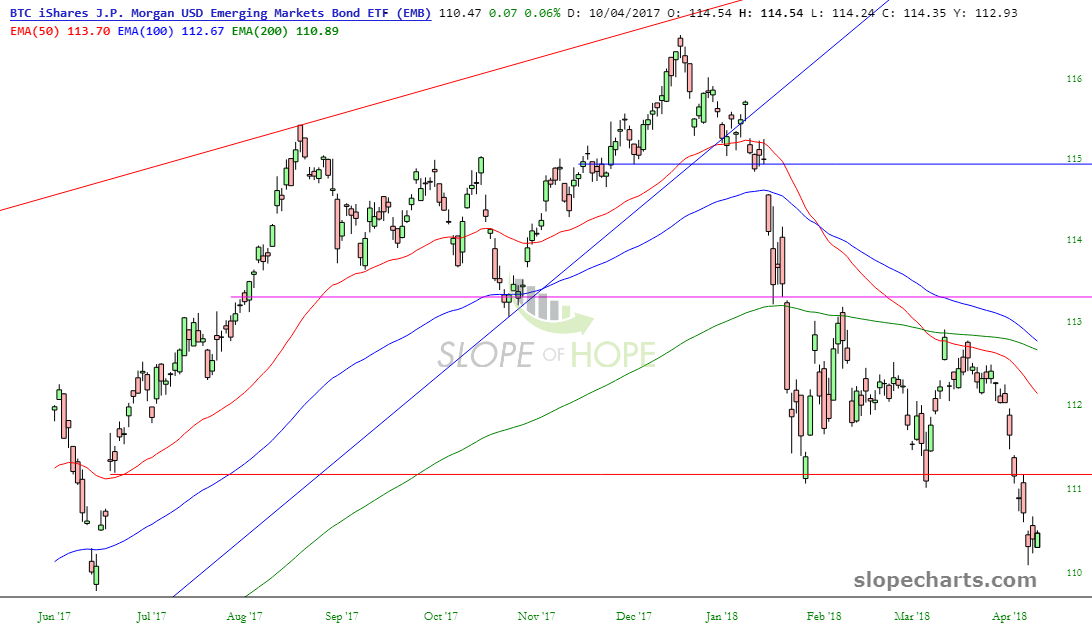
In sharp contrast to this, theEMB ETF has been far more consistent. This emerging market bonds fund is one of the few financial instruments in which the moving averages have all lined up into full-on bearish mode.
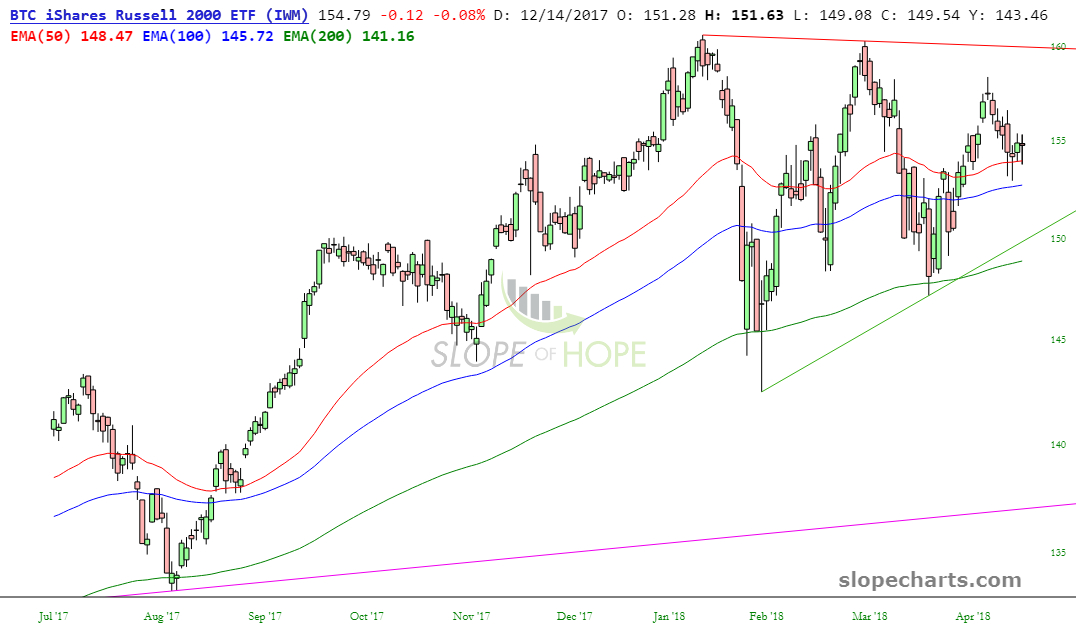
But as for equities in general, such as the small cap IWM here, you can see far more of a steady-as-she-goes drift to the moving averages. In this case, there isn’t a single crossover. Yes, the 50 and 100 day averages are closer than they used to be, but they aren’t showing any breakdown.
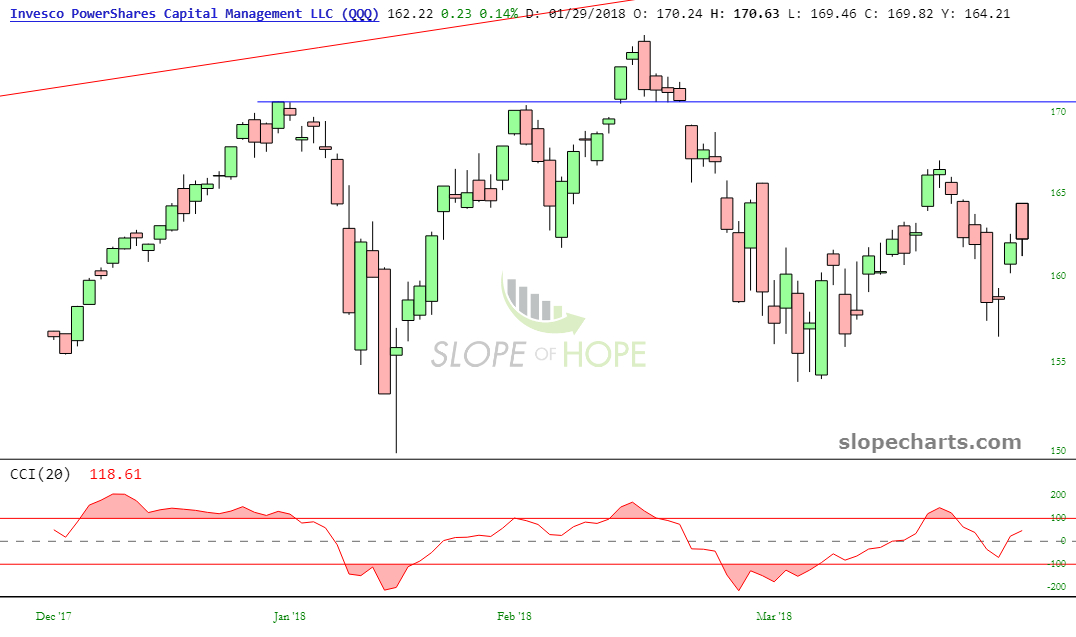
At the risk of being the “meander” horse to death, the NASDAQ (by way of the QQQ) is another example. We’re not at a very different level than we were even five months ago. We’ve just been going through this annoying sine wave.
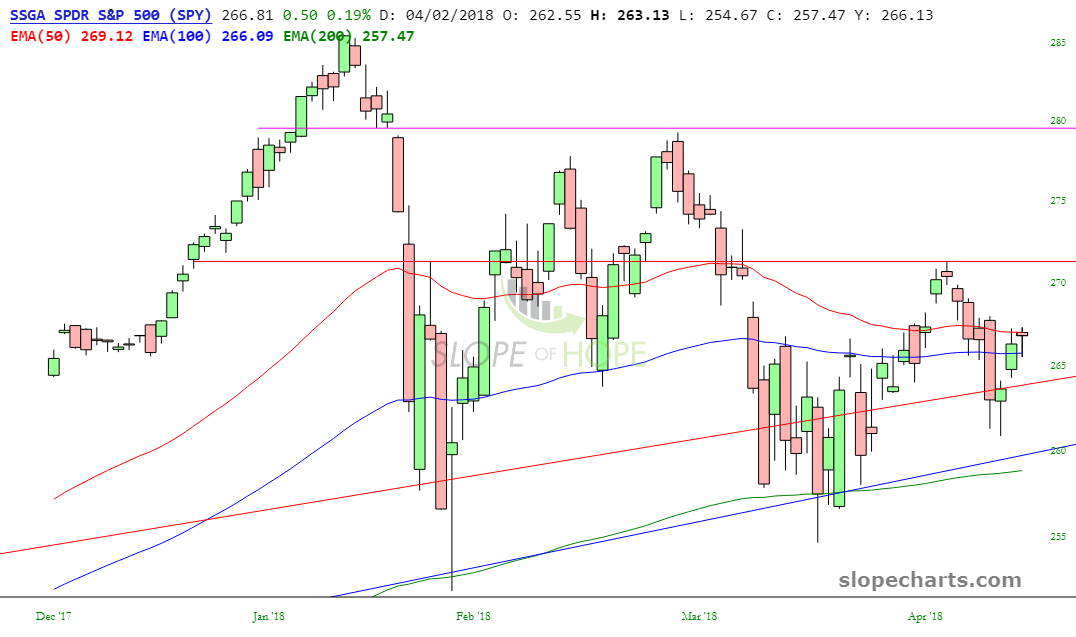
Whereas the QQQ has been traveling relatively horizontally, the S&P 500 (by way of the SPY ETF) has been expressing itself in a series of lower highs. Even with the big lift we got in the second half of the week, the market is clearing “leaking”, and the 50-day EMA is getting within range of crossing beneath the 100-day.
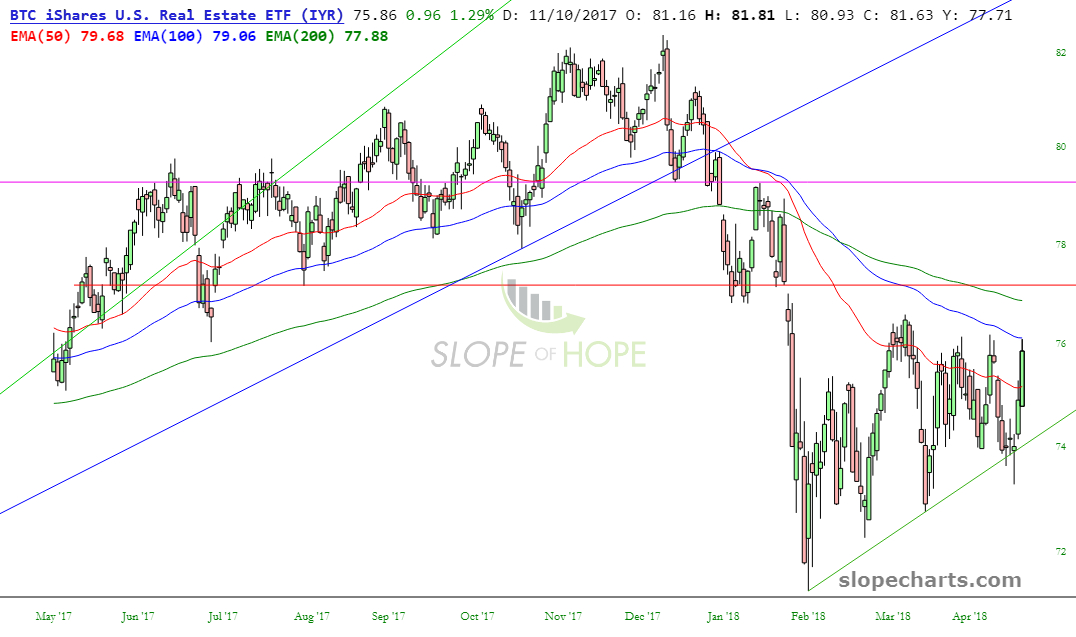
I’ll close with an especially important sector to me: real estate, by way of the IYR. Friday had a big spike higher, but please note a couple of things: (1) as with the EMB shown above, the moving averages are in a clear downtrend (2) the spike on Friday tagged the middle moving average, the 100-day, perfectly, suggesting the good chance of weakness next week.
