Precious metals expert Michael Ballanger describes why he thinks the upcoming week will be "favorable" for silver investors.
First, this has been a spectacular month for me in that I was fortunate enough to have parlayed the profits from the UVXY trade successfully, having bought a whackload of call options in the Physical Silver ETF (NYSE:SLV) and a 300-lot of the Fortuna Silver Mines (TO:FVI) May $5 calls. As I wrote earlier in the week, I think we are seeing the biggest dislocation between any two assets in decades with the current ratio of gold to silver. For gold to be threatening a multiyear breakout of the $1,375 resistance while silver atrophies in the mid-$16s was , at least to me, absurd.
And absurd it was, as the GTSR (gold to silver ratio) hit 86 late last week and now resides at slightly above 78. I placed a rather large bet on silver outperforming gold on Tuesday, with the ratio at 82.3:1, so at 78.06 to close out the week and the SLV calls up 80% with RSI still only 63.25, it feels like we are going to ring the register shortly despite the modest setback today.
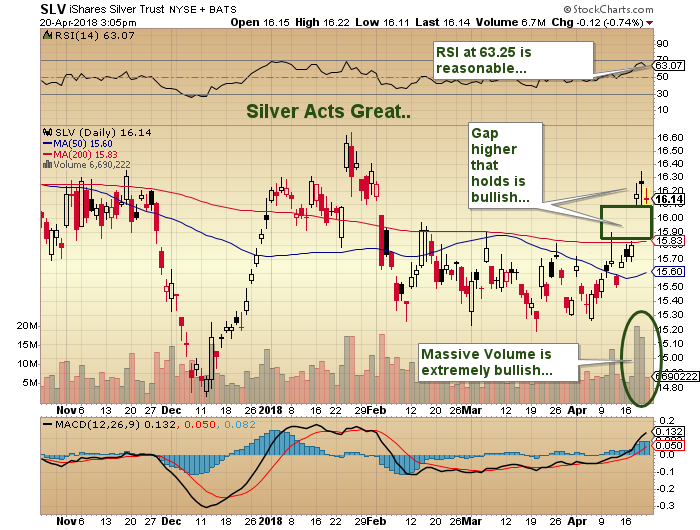
As bullish as I might like to think that silver is, I have been forced to look the creature called "greed" straight in the eye and deal with him. Painfully, embarrassingly, over the years, I have learned that it is exactly at the point where the PMs appear to be ready to "explode" that I have committed the greatest of human errors by letting hope override common sense. When hope overrides common sense, you are immersed in "hopium," the most insidious of all narcotics found in bloodstreams of failed traders.
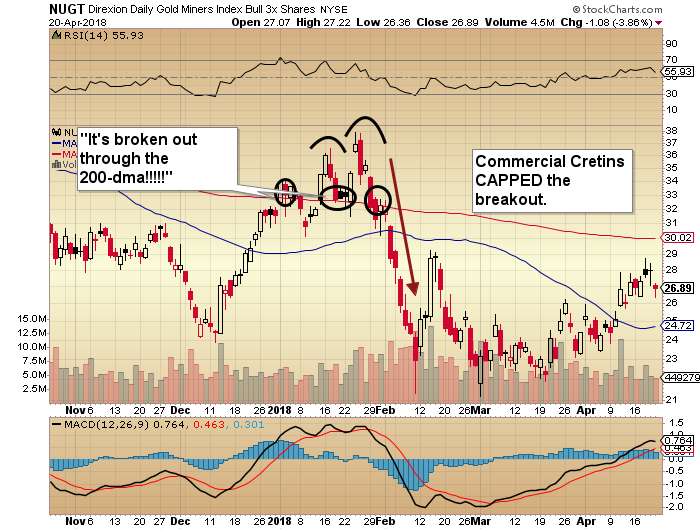
You will recall when I analyzed the gold sector at the end of January and warned that the Commercials were going to "allow" the gold price to briefly "break out," only to entrap the Large Specs and then disembowel them. That is exactly what they did. At that time I was long Direxion Daily Gold Miners Bull 3X Shares (NYSE:NUGT) and Direxion Daily Junior Gold Miners Bull 3X Shares (NYSE:JNUG) and a boatload of calls, and I was looking to make a huge score with NUGT moving to the 2016 highs around $50.
Well, the COT structure was suspect and there was just too much chirping from the gold newsletter writers about the "200-dma" (all in CAPS and with numerous exclamation marks), and sure enough, I sold my calls when the NUGT first popped through the 200-dma around $32. It was a decent "pass" but by no means a "life-changer," and I was thoroughly ready to do an on-purpose alcohol overdose to end all pain when the NUGT proceeded to $37 and the calls I just sold for a double became a quadruple.
The angst in late January was unbearable because I made the "call" in December and was at risk of leaving the spoils of victory on the table, so to speak, but when I finally emerged from the self-medicated stupor of self-recrimination, the market responded exactly as I had theorized and proceeded to collapse. I must tell you that there is no solace in being right on a prediction if you haven't monetized it. However, there is solace if you have lived to fight another day—and I did and I have.
Which brings me to the point of the current silver trade. First of all, silver is going a great deal higher over the longer term and as a haven against currency destruction and wealth depravation, it remains not "as good as gold." But it is first subordinate to my beloved gold. It is a shiny little metal and when buffed up, carries a luster of amusing intensity and intrigue. However, there is nothing on the planet that carries the refined beauty and regal magnificence of gold, and as much as I use gold as the ultimate store of value, there are indeed times in the trading arena—not the investing arena—that one must seize the advantage. Gold is going to surge through $1,400 before we have our swimsuits on, but between now and that moment (where you see that the "L" on the suit has morphed to an "XXL"), we are going to be handed a final wicked attempt by the cretins to crush sentiment and advance to status quo of "long stocks and short gold."
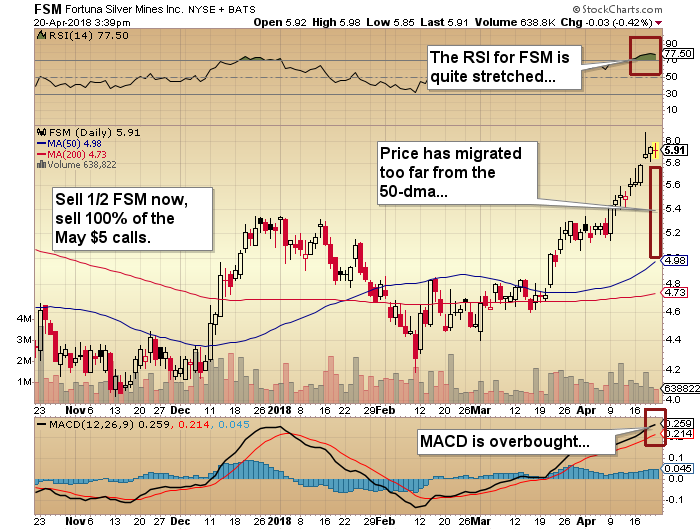
In the interim, I have to manage my trade. I have liquidated 50% of the Fortuna position (agonizingly) because of the RSI, which is at 77.50 but was over 80 yesterday. I owned only May expiry call options on FSM, so I also blasted every option I owned in the $0.50s when they went $1.00 bid yesterday. Fortuna is my favorite proxy for silver as it is a great little company with miners (as opposed to "money men") at the helm, and they really know how to exploit the two best locales in the world for silver deposits (Peru and Mexico).
However, with RSI and MACD threatening to blow the chart borders to smithereens, FSM is severely "overbought." Hence, I have taken profits in the call options because May expiry is just too close. I keep 50% of the shares because while I may be able to replace the shares I sold at $6.03. If I am wrong and it powers ahead to $7.50-8.00, I am still a shareholder.
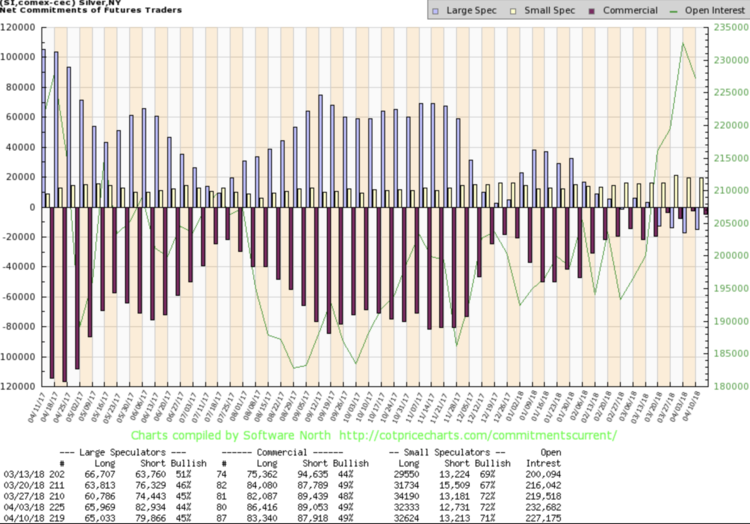
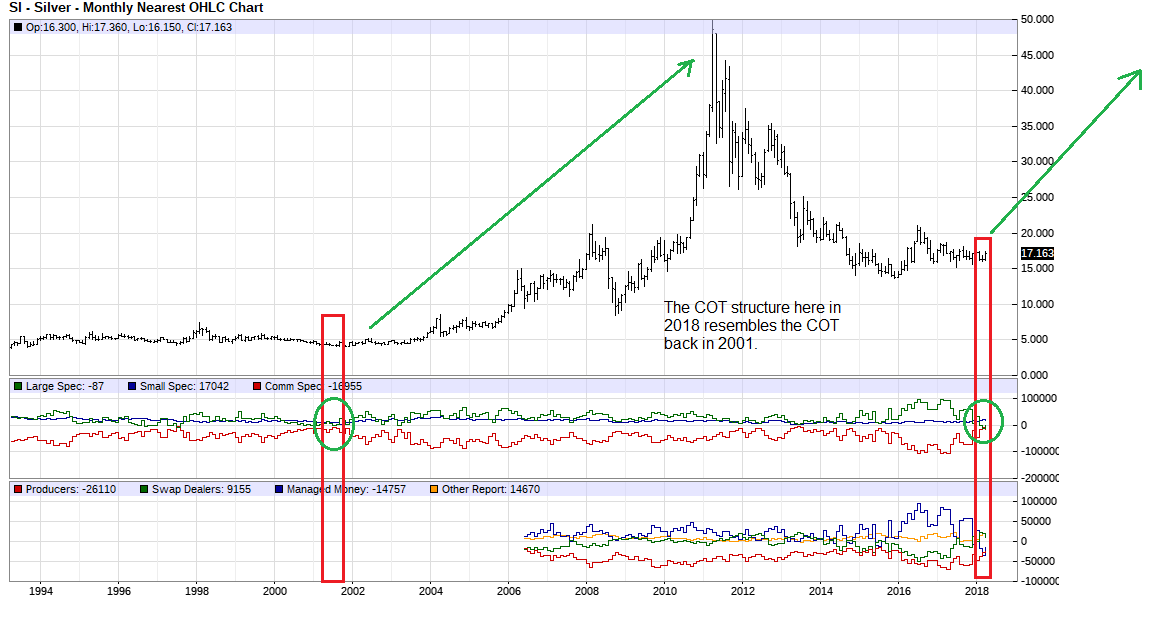
The chart I am presenting below is the COT structure (for silver) for last week, and while it is not a "current" chart, look the optics. At the extremes (in the middle), there was a superb opportunity to short the silver market. Now, there is zero opportunity to do the same. It is the singular most powerful set-up I have seen in any market—ever.
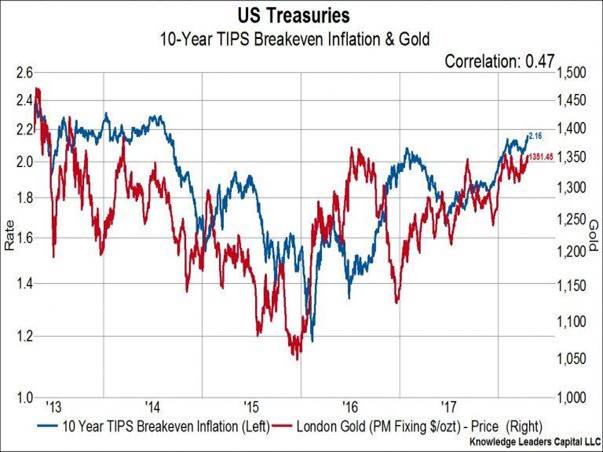
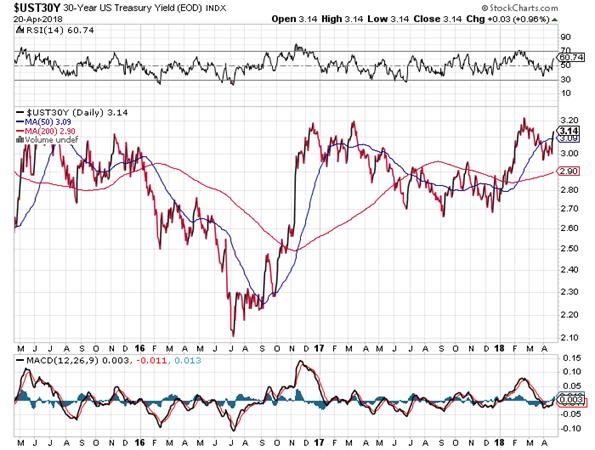
OK, I have been nattling far too long about "trades," so now I remove the warm-up jacket and get down to business. The chart shown below is the TIPS (Treasury-Inflation-Protected-Securities) chart measured against the price of gold going back to 2013, and you can see the near-perfect correlation between the 10-year TIPS Breakeven Inflation and the gold price. I also threw up the chart of the 30-year Treasury yield, indicating that the bond market has definitively sniffed out the return of higher inflation rates and now we have gold, bonds, and the TIPS marching forward with sirens blaring and red lights blinking.
The S&P 500 and NASDAQ have decided to ignore this since 2016, but recent volatility spikes are again proof positive that stocks are starting to smell inflationary trouble. The attendant flattening (soon to be inverting) yield curve is confirming.
The greater question for precious metals enthusiasts revolves around the possibility of the metals being sucked downward into a liquidity squeeze, as in 2008, to which I respond "not a chance." In 2008, gold mining stocks and silver and gold bullion were over-owned and overbought after a five-year vertical ascent. The hedge funds had levered up on gold and silver with massive net long positions that had to be reversed once the subprime bubble was pricked.
Here in 2018, as seen in the recent COT report, the Large Speculators in silver are actually net short, which is a historical anomaly and the first ever of its occurrence. Gold at 163,000 net longs, held by the same, is a relative modest number when matched off against the 185,000 Commercial short position. In 2008, at or near the peak, those numbers were north of 300,000. I therefore am going to assume that an equity market drawdown will not impact gold to any great degree. Interestingly, I think it might actually cause a spike in silver, as the offsetting trade that will reduce exposure for the Large Specs will be net purchases of silver (to remove their shorts). (Forgive the pun.)
As my graphics below show, the silver pop from the low $16s to $17.25 in the past several days has seen that big Large Spec net short position pared down, but they are still net short 87 contracts as of last Tuesday. The April 24 COT will be interesting, especially if we see that both the Commercials and the Large Specs have shorted more into the move. I say no.
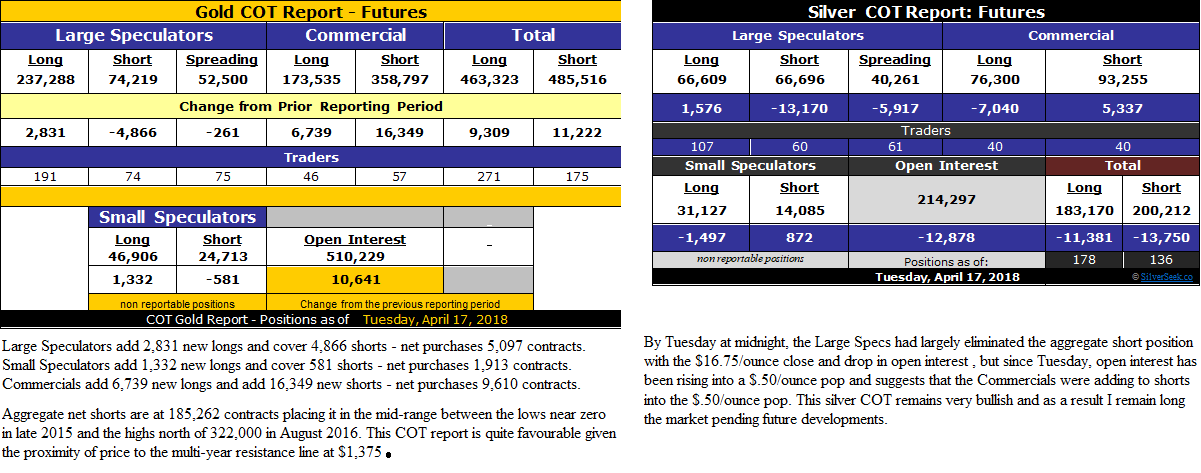
All in all, I would classify last week's metals action as favorable, but there seems to be that "invisible hand" keeping gold from ascending through the much publicized $1,365-1,375 resistance band. When I say "much publicized," do a scan of all of the gold websites and in every single commentary (including this one) the authors reference this resistance zone. I find it amusing that every technician out there is alluding to the ultimate bullish breakout as a "given," but nobody will put their innards on the line and tell us "when."
Except me. I am carrying overweight positions in silver (shares, calls and physical), and am short the GTSR at 82.35. I am planning for gold to be in the $1,400s by June, which takes the GTSR under 70—which means that silver prints $20 and the percentage move in the silver miners and silver itself is the high-octane play to start off the summer.
To give you an idea of just how bullish the silver COT is historically, look at the 20-year COT shown below, and pay particular attention to 2001, when silver was under $4 per ounce. I am not going to jinx my precious silver positions by even uttering "that word" that describes what I am expecting to see in the next few weeks. But I will give you all a hint: It rhymes with "sneeze;" it is what you are not supposed to do to the Charmin; and it is how a boa constrictor kills its prey.
Originally trained during the inflationary 1970s, Michael Ballanger is a graduate of Saint Louis University where he earned a Bachelor of Science in finance and a Bachelor of Art in marketing before completing post-graduate work at the Wharton School of Finance. With more than 30 years of experience as a junior mining and exploration specialist, as well as a solid background in corporate finance, Ballanger's adherence to the concept of "Hard Assets" allows him to focus the practice on selecting opportunities in the global resource sector with emphasis on the precious metals exploration and development sector. Ballanger takes great pleasure in visiting mineral properties around the globe in the never-ending hunt for early-stage opportunities.