The Short Term picture has been favoring bulls with indices knocking at new all-time highs. However, the Long Term picture hasn't really improved to the same degree.
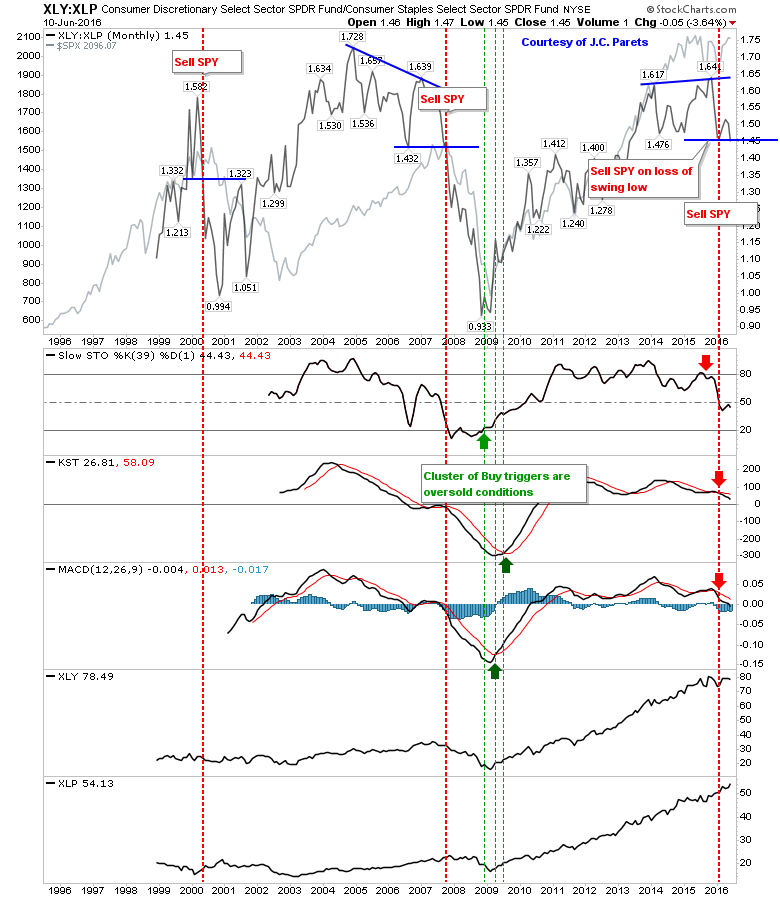
This chart of the relationship between the Consumer Discretionary ETF (NYSE:XLY) and the Consumer Staples ETF (NYSE:XLP), which J.C. Parets had shown in the past, has taken another turn in favor of bears. With the S&P 500 at new highs, the ratio between Discretionary and Staples is about to post a new swing low to levels last seen in 2013.
Should these losses accelerate, it could lead to the sort of market declines last seen in 2000 and 2008. If this occurs, the media may pin it on Brexit/Trump/Kittens, but in the battle between supply and demand, supply could be in the ascendancy.
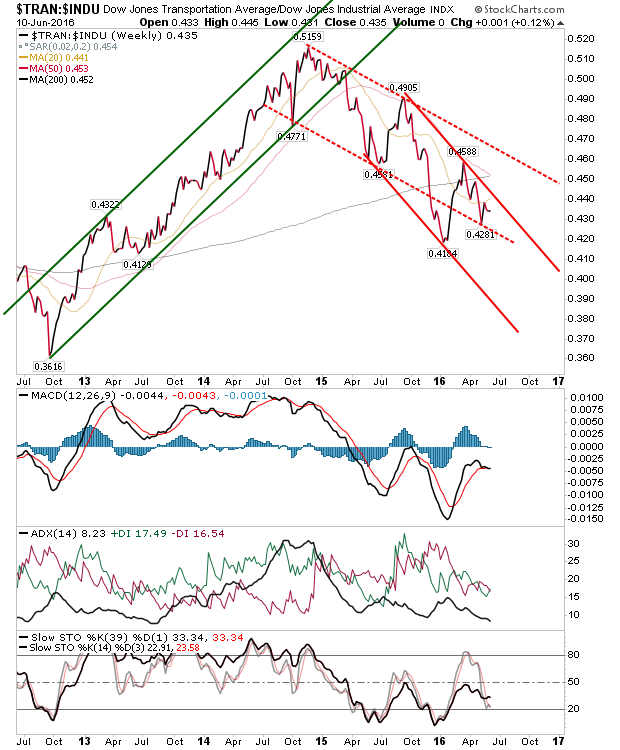
Another bearish marker is the relationship between Transports and the Dow Jones Industrial Index. Confirmation of a secular bull market comes when new highs in Transports are matched in the Dow Jones Index, but since 2014 the relationship has been in decline. And in 2015, there was an acceleration (in a downward channel) with an upcoming 'Death Cross' between the 50-day and 200-day MAs.
Other technicals also support the bearish picture with a MACD below the bullish zero line and Stochastics [39,1] struggling to cross the bull/bear mid-line.
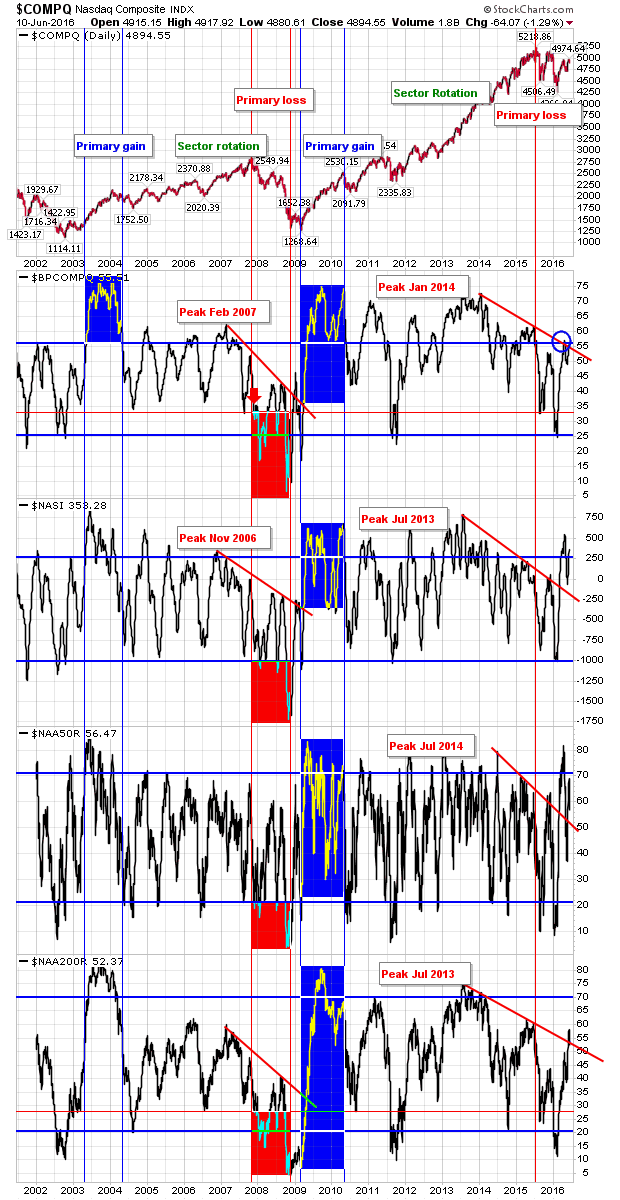
NASDAQ breadth has been knocking around overbought levels. Bullish Percents have tagged declining resistance, established with a sequence of lower highs. Soon, fewer than 50% of NASDAQ stocks will be on point-n-figure 'buy' signals. Not exactly a recipe for long term success.
The Summation Index is closer to overbought, leaving little room for more upside. Finally, the percentage of stocks above 50-day and 200-day MAs is also knocking around the 50th percentile mark; an index near all-time highs with nearly half of component stocks struggling below key long term moving averages. This suggests a washout is required before a sustained rally can emerge.
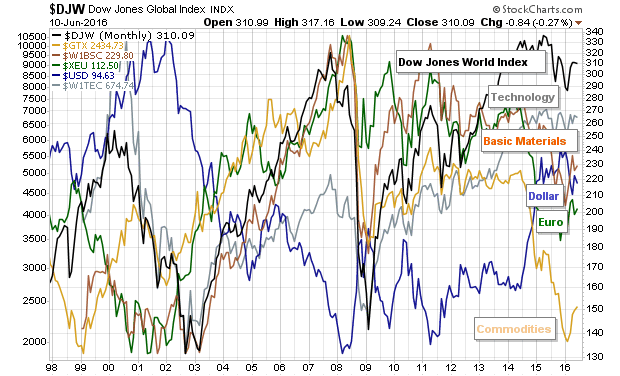
In a relationship between different assets, commodities are in the value bucket, but world stocks are overvalued.
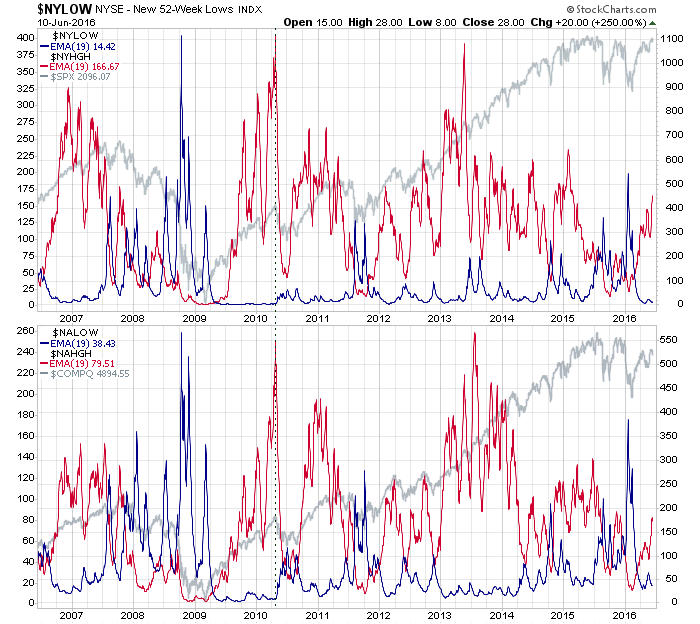
One thing actually working in bulls' favour is the New 52-week Highs / Lows. The NASDAQ and NYSE reached levels associated with trade-worthy lows in February.
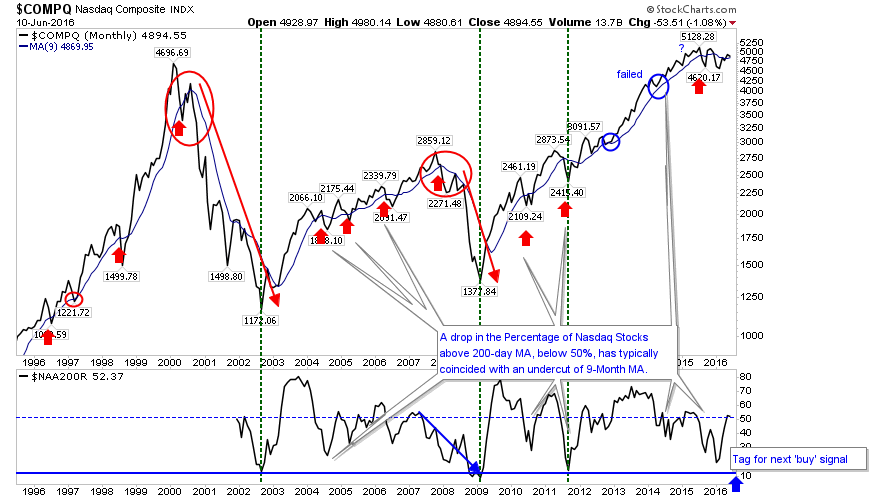
Finally, the monthly NASDAQ chart is caught is in a bit of a no-man's land, struggling to stay above a 9-month moving average which has been a reasonable marker for bull and bear markets.
So, while my daily commentary suggests bulls have room to play with, the longer term picture suggests their time may be coming to an end.

