A week or so ago, silver was all the rage. The talk ranged from an inflation indicator, to the industrial usage to the outperformance to gold as key.
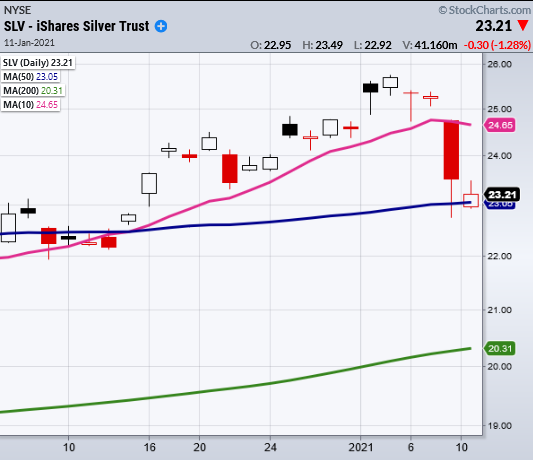
Then, last Friday, silver (and gold) tanked. Silver breached the 50-DMA but closed above it.
Monday, it also declined, but not only held the 50-DMA but closed within an inside day to Friday’s large candle.
The inside day is a common pattern where the range of a candle fits completely inside the range of the previous day.
Furthermore, the pattern creates a digestion or consolidation area creating clear points using the prior days high or low to break out or down from.
Is this the cheap buy opportunity in silver for those who missed it in late November?
On the weekly chart, iShares Silver Trust (NYSE:SLV) is sitting on a weekly exponential moving average.
On the monthly chart, it rallied right up to the Bollinger® Band at 25.68 before retreating.
Yet it is the daily chart that tells us exactly what to do.
The closing level on Friday was 23.51. Monday’s high was 23.49. Friday’s low was 22.74.
That tells us, a move back over 23.51 gives bulls a low risk buy under 22.74.
Whereas the bears can sell under 22.74 anticipating the next support level to be touched at 21.05 area.
If we had to choose, we are still leaning towards to upside and will be watching carefully.
Key Levels
Russell 2000 (IWM) Inside day. 209.77 high to clear. Support 200.
NASDAQ (QQQ) Watch the 10-DMA to hold at 312.95
KRE (Regional Banks) 58.47 2020 highs
SMH (Semiconductors) 221.79 support.
IYT (Transportation) 221 must hold.
IBB (Biotechnology) Inside day. 153 support
XRT (Retail) New all-time high close
