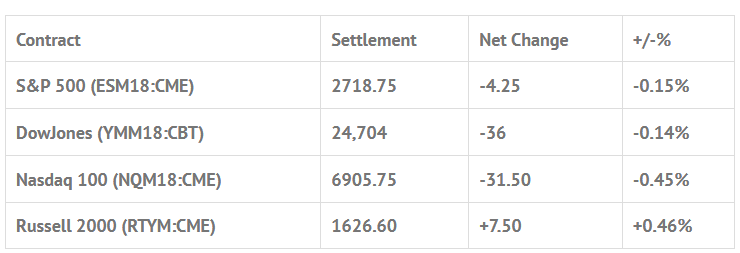
Index Futures Net Changes and Settlements:
Foreign Markets, Fair Value and Volume:
- In Asia 7 out of 11 markets closed higher: Shanghai Comp +1.23%, Hang Seng +0.34%, Nikkei +0.40%
- In Europe 7 out of 13 markets are trading lower: CAC +0.08%, DAX -0.06%, FTSE -0.12%
- Fair Value: S&P +0.01, NASDAQ +6.66, Dow -6.83
- Total Volume: 1.06mil ESM & 1,469 SPM traded in the pit
Today’s Economic Calendar:
Today’s economic calendar includes Loretta Mester Speaks 3:00 AM ET, Robert Kaplan Speaks 9:15 AM ET, Lael Brainard Speaks 9:15 AM ET, and the Baker-Hughes Rig Count 1:00 PM ET.
S&P 500 Futures: Buy Russell 2000 / Dow & Nasdaq
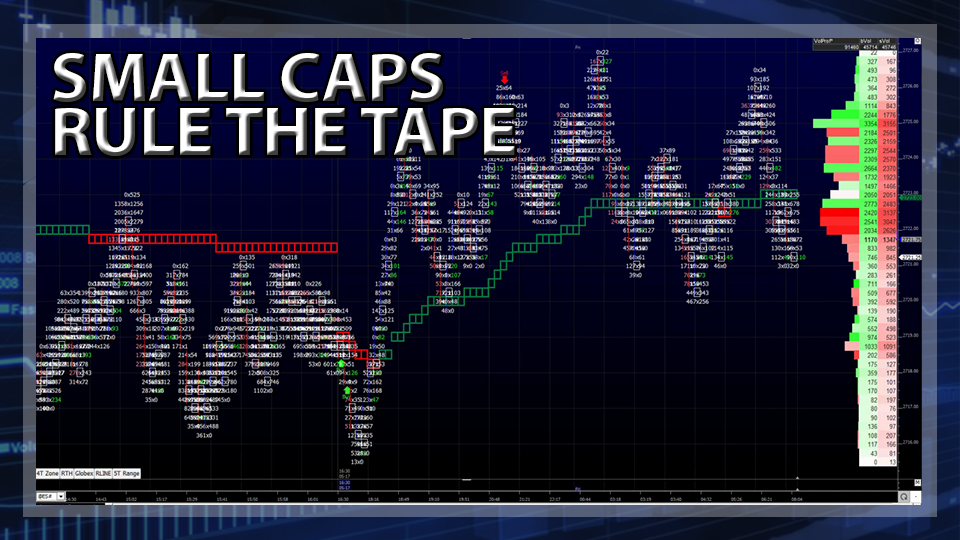
Wednesday night, Asian markets slipped, and Europe traded mostly higher. Global stocks struggled as government bond yields and oil prices hit multi year highs. The S&P 500 futures were down -0.20% on Globex, with an overnight trading range of 2715.50 to 2725.25, on volume of 115,000 contracts.
The first print off the 8:30 futures open was 2719.50. The ES initially traded up to the 2720.50 level and then sold off down to an early low of 2713.50 at 8:42, then by 9:26 traded up to 2732.00. Tt 9:55 the futures had pulled back down to 2624.00, popped up to the 2728.00 area, and then flunked down to 2711.00, a 22.25 handle drop.
After the selloff the ES rallied up to 2723.00 before pulling back down to 2717.25 as the MiM went from $364 million to buy to $357 million to sell. On the 2:45 cash imbalance reveal, the actual MOC came to $200 million to sell, and on the 3:00 cash close the ES traded 2719.75, before going on to settle the day at 2718.50 on the 3:15 futures close, down -3.25 handles, or -0.12% on the day.
In the end it was another slow day on a list of many recently. The markets rallied early and then flunked. The big thing was the volume… There was none.
Stock Portfolio Updates: Cash Balance Grows as “Worst Months” Underway
From Stock Traders Almanac:
For the second day in a row, the Russell 2000 index of small-cap stocks closed at a new all-time high. However DJIA, S&P 500 and NASDAQ still have some ground to cover before doing the same. NASDAQ is closest followed by S&P 500 and then DJIA. Small-cap strength is encouraging, but absent the support and participation of the other indices the run could be short-lived.
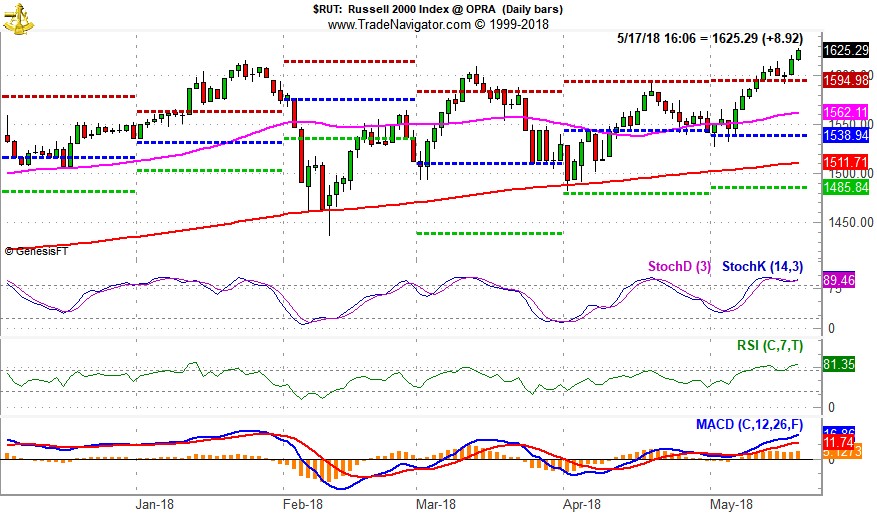
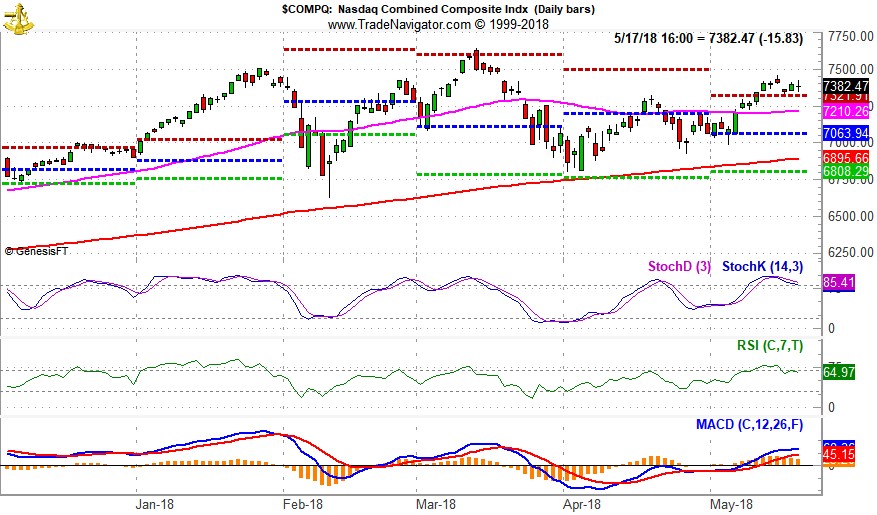
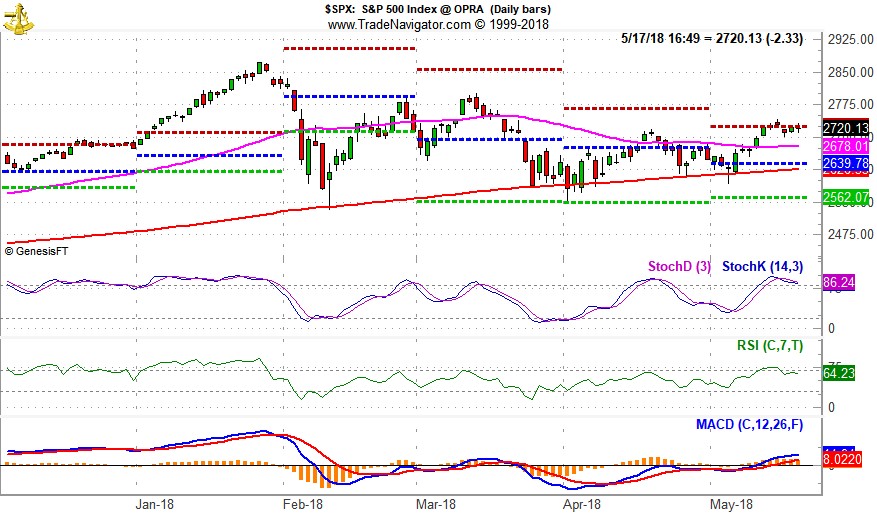
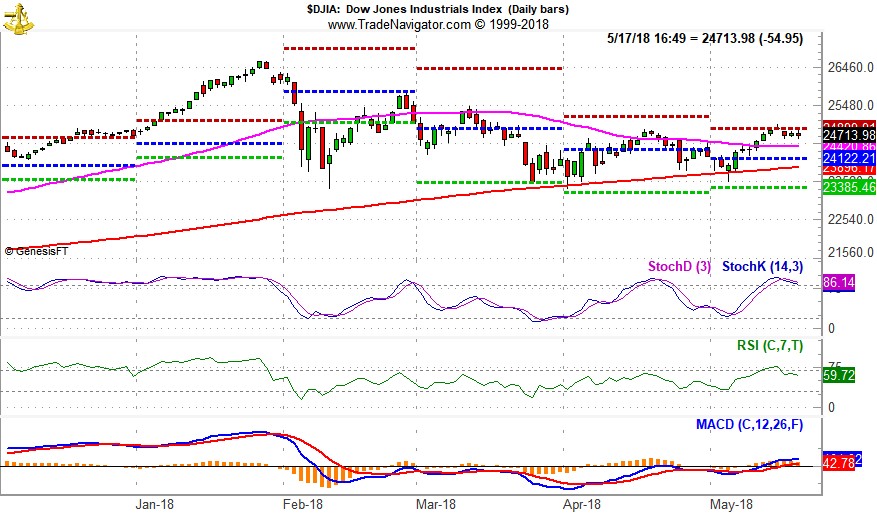
DJIA and S&P 500 both found support at their respective 200-day moving averages (solid red lines in upper portion of above charts) earlier in the month before bouncing higher. That bounce ended when DJIA and S&P 500 ran into projected monthly resistance (red dashed line) last Friday. Both have been churning essentially sideways since then. Both will need to break through this level before making any run towards old highs.
NASDAQ’s chart is somewhat healthier than DJIA and S&P 500. This does not come as much of a surprise as NASDAQ typically enjoys a “Best Eight Months” that run November through June. As earnings season winds down and the three-day Memorial Day weekend nears, catalysts for the market to continue higher in the near-term are fading increasing the possibility of move sideways to lower trading.
Disclaimer: Trading Futures, Options on Futures, and retail off-exchange foreign currency transactions involves substantial risk of loss and is not suitable for all investors. You should carefully consider whether trading is suitable for you in light of your circumstances, knowledge, and financial resources. Any decision to purchase or sell as a result of the opinions expressed in the forum will be the full responsibility of the person(s) authorizing such transaction(s). BE ADVISED TO ALWAYS USE PROTECTIVE STOP LOSSES AND ALLOW FOR SLIPPAGE TO MANAGE YOUR TRADE(S) AS AN INVESTOR COULD LOSE ALL OR MORE THAN THEIR INITIAL INVESTMENT. PAST PERFORMANCE IS NOT INDICATIVE OF FUTURE RESULTS.

