Investing.com’s stocks of the week
On the topic of recycling, a lot of news has been creatively and skillfully recycled.
- Tariff talks on, tariff talks off.
- Federal Reserve will stand put on interest rates; the Federal Reserve is dovish.
- The dollar is king, the dollar is too strong.
- Impeachment proceedings are impacting sentiment, impeachment proceedings do not make a difference.
The bigger point is two-fold.
First off, regardless of the recycled news, the market continues to trade in this huge disconnect.
The S&P 500, Nasdaq 100 and the Dow traded again to new all-time highs.
The Russell 2000 (IWM) closed red.
Secondly, every time the disconnect emboldens the bears, the pitchfork immediately appears with the prickly message that they should “Eat Crow.”
John Templeton once said, “Bull-markets are born on pessimism, grow on skepticism, mature on optimism and die on euphoria.”
Given the bizarre circumstances in the market, what would create euphoria, hence the day the bulls eat crow?

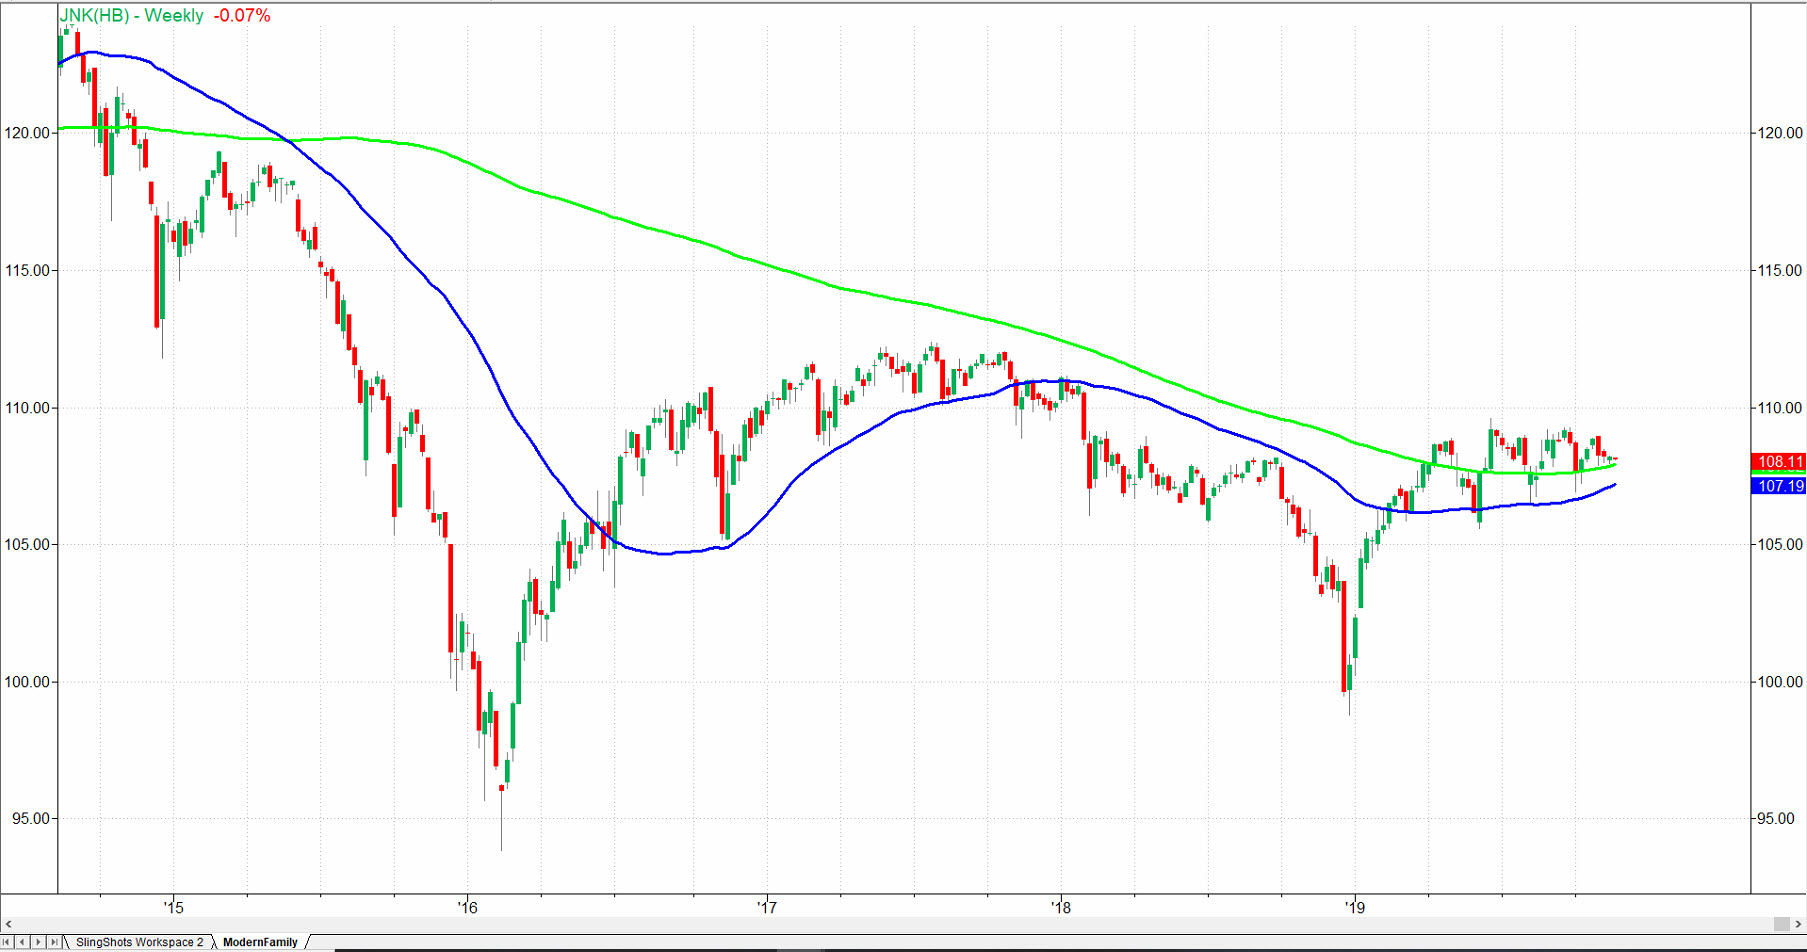
In my quest to sort the disparity between the economic modern family and the top performers of the market out, I examine junk bonds (JNK).
Junk bonds represent bonds that are issued by companies that are doing poorly financially. These companies have a high risk of defaulting or not paying their interest or principal to investors.
Because of the risk, junk bonds pay higher yields.
High-yield junk bonds are attractive when the anticipation is for lower rates for a longer timeframe. Furthermore, the price of junk bonds will rise if the anticipation is that these weak companies will improve.
Junk bonds in general, serve as one indicator for investors’ appetite for risk.
In other words, Mr. Templeton’s bullish euphoria phase can be partially measured by looking at JNK.
The weekly chart shows the price above both the weekly moving averages-the 50 and 200-WMA. That makes the weekly phase bullish.
In terms of price, a move over 110 should help bring the market to its euphoric knees. A move below 107, will most likely mean that the best the market has given bulls this run, is optimism.
Am I one of the bears that has swallowed the pitchfork filled with crow?
I have not been bearish.
However, I am willing to swing that way.
Besides watching for the weak conditions in the Russell 2000, Transportation and Retail to improve, we can also watch what investor’s appetite for risk is as well.
S&P 500 (SPY) 309.10 support. All-time high 312.28.
Russell 2000 (IWM) 155-156 Key support. 157.75 Pivotal. 160.46 resistance.
Dow (DIA) A new all-time high at 280.36. 277.45 now nearest support
Nasdaq (QQQ) All-time highs at 203.39. 201.30 support.
KRE (Regional Banks) A move under 55.40 should bring in more selling. 57.52 next resistance to clear
SMH (Semiconductors) 135.26 all-time high. Breakaway gap intact if holds 130. Interim support at 133.20
IYT (Transportation) 195 pivotal 194 some support and must clear 200.42
IBB (Biotechnology) 108.75 support. 115 major resistance
XRT (Retail) 44.30 pivotal. 45.68 resistance
