What if Trump’s trade war leads to less protectionism and more global prosperity? What if Trump’s deregulation of business unchains the animal spirits of businesses, especially smaller ones that arguably have been more stymied by regulations than large ones? What if jobs actually do come back to the US?
What if the pace of technological innovation is increasing, disrupting business models in ways that keep a lid on inflation and finally boost productivity? What if the growth of distressed asset funds has created a shock absorber in the capital markets, reducing the severity of credit crunches? What if Baby Boomers downsize, while Millennials remain minimalists?
I can go on, but we have enough to work with in this list of “what ifs.” So let’s explore the implications of these mostly bullish possibilities:
(1) What if Trump’s trade war leads to less protectionism and more global prosperity? Before launching his economic wars, Trump bolstered the home front’s economy with deregulation and tax cuts. He figures that strength will allow the US to win his wars without much, if any, pain at home. So far, the US stock market seems to be siding with Trump’s approach. The message from the markets seems to be: “What if Trump wins his trade wars and if his sanctions work?” Investors are giving quite a bit of weight to the possibility that this all will lead to less protectionism and greater global prosperity. I agree with this prognosis.
Trump can just as quickly deescalate as escalate his trade skirmishes with our major trading partners, depending on the progress made in negotiations. I’m convinced that our side is pushing for fairer trade with fewer trade barriers, not higher tariffs, which Trump is using as a tactical negotiating tool.
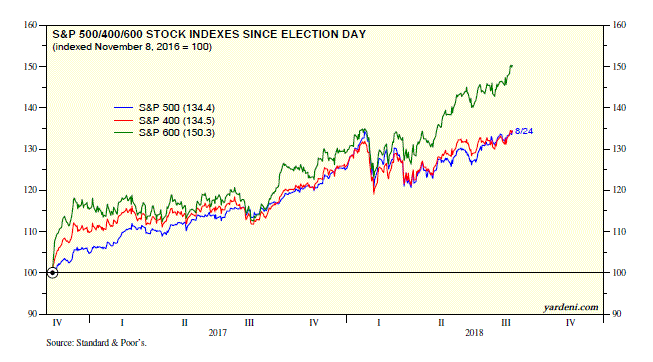
(2) What if Trump’s deregulation of business unchains the animal spirits of businesses, especially smaller ones that arguably have been more stymied by regulations than large ones? It’s impossible to measure the impact of Trump’s deregulation of business on S&P 500 earnings. The stock prices of small corporations have been outperforming the larger ones since Trump was elected on November 8, 2016. Since then through Friday, August 21, the S&P 600 Small Caps stock price index is up 50.3%, outpacing the 34.4% of the S&P 500 Large Caps and 34.5% of the S&P 400 Mid Caps (Fig. 1). Many observers have attributed this to the fact that smaller companies are less exposed to damage from a trade war than larger ones.
There might be another important reason why Small Caps are doing so well: Small companies may be getting a bigger after-tax earnings boost from Trump’s tax cuts than larger corporations that have had the means to dodge taxes better (Fig. 2).
That still begs the question of why small companies’ revenues are so strong on a relative basis (Fig. 3). Perhaps Trump’s deregulation policies benefit smaller companies more than larger ones. After all, regulations are often promoted by large companies to keep small competitors at bay. The monthly survey conducted by the National Federation of Independent Business (NFIB) shows that significantly fewer small business owners have been reporting concern about government regulation and taxes since Trump was elected (Fig. 4 and Fig. 5).
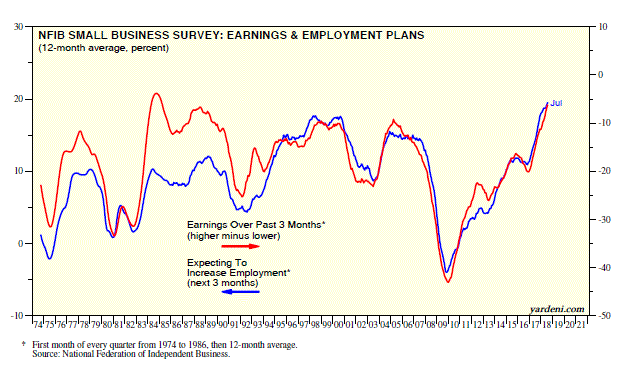
No wonder the earnings component of the NFIB survey is the highest on record since the start of the data during 1974 (Fig. 6). This series is highly correlated with the NFIB “expecting to increase employment” series, which is also at a record high.
(3) What if jobs actually do come back to the US? Since November 2016, payroll employment is up 3.9 million, including 412,000 manufacturing jobs. The unemployment rate has dropped from 4.6% back then to 3.9% during July. Trump obviously relishes taking credit for all this. It has long been my view that Washington doesn’t create jobs; companies do that, especially small ones. Washington’s policies can make it easier or harder for companies to hire. Trump’s policies are certainly helping.
In any event, the ADP payroll employment data show that small, medium, and large companies have increased their head counts by 1.0 million, 1.6 million, and 1.2 million since November 2016 (Fig. 7). The smaller ones represented in the NFIB survey are running into staffing problems. During July, a record 37% of small business owners reported having job openings (Fig. 8). At the same time, 52% reported few or no qualified applicants for their job openings.
To relieve this pressure, the best solution would be for a bipartisan congressional agreement on migration that would allow more legal immigrants to enter the US to fill job openings. Of course, of all the “what ifs,” this one is the most farfetched given the political divide in Washington. More likely is that companies will continue to reach out to able-bodied workers who have dropped out of the labor force. Even more likely is that companies will accelerate their use of technology to boost productivity.
(4) What if the pace of technological innovation is increasing, disrupting business models in ways that keep a lid on inflation and finally boosts productivity? The rebound in manufacturing employment mentioned above augurs well for manufacturing production, and possibly for productivity (Fig. 9).
Not widely recognized is that since China entered the World Trade Organization at the end of 2001, both manufacturing production and capacity in the US have been flat (Fig. 10). Obviously, lots of manufacturers moved their operations to China, and didn’t spend much on enhancing their productivity in the US. So while it is widely believed that the slow pace of productivity growth in the US is mostly attributable to the services sector, the fact is that the five-year annualized growth rate of manufacturing productivity peaked at 6.0% during Q3-2003 and plunged to zero in recent years (Fig. 11).
If Trump succeeds in bringing production back to the US, then manufacturers might be hard pressed to find enough workers and turn to boosting their productivity instead of raising their wages.
Meanwhile, the rapid pace of technological innovation continues to disrupt business models in both the manufacturing and services sectors. This is forcing all businesses to focus on innovations to remain competitive. Raising wages and prices in this highly competitive technology-driven business environment may be a sure way to fall behind.
(5) What if the growth of distressed asset funds has created a shock absorber in the capital markets, reducing the severity of credit crunches? If you blinked, you might have missed the mini-recession of 2015. It was more of a growth recession than an actual drop in business activity. The credit markets saw it coming, as the credit quality yield spreads between corporate high-yield bonds and the 10-Year Treasury bond soared from a low of 253 bps on June 23, 2014 to a high of 844 bps on February 11, 2016 (Fig. 12). That was attributable to the collapse in commodity prices, led by a 76% plunge in the price of a barrel of Brent.
There was an immediate credit crunch for commodity producers. But it ended remarkably quickly without turning into a contagion. The credit quality spread dropped back down to 362 bps by the end of 2016 and has fluctuated around there since then. That’s because distressed asset funds jumped in and restructured the balance sheets of distressed commodity producers by converting debt into equity. I calculate that just in the S&P 500 Energy sector, the share count rose from 17.2 billion during Q4-2015 to 18.3 billion during Q4-2017 (Fig. 13).
Distressed asset funds certainly acted as an important shock absorber for the credit markets during 2015. They are likely to do so again during the next credit shock.
(6) What if Baby Boomers downsize, while Millennials remain minimalists? The current economic expansion will be the longest on record next year during July. It is likely to achieve that milestone and exceed it partly as a result of demographic trends. This year, the number of singles outnumbered the number of married people for the population aged 16 years or older. The percentage of singles has risen from 37.7% during 1977 to 50.8% last month (Fig. 14).
This trend has been mostly driven by “never married” singles (Fig. 15). Many of them are Millennials who are postponing getting married if they ever do so at all. They are minimalists who aren’t big earners or spenders because they need only support themselves. The Baby Boomers were big spenders when they were getting married and having kids. They too are turning into minimalists as they trade down to smaller houses and apartments now that they are empty nesters.
These demographic trends suggest that the pace of consumer spending growth will remain lower than during the heydays of the Baby Boomers. If so, this may keep a lid on economic growth and reduce the likelihood of a boom. If there is no boom, there is less likelihood of a bust.
(7) Conclusion. Why not . . . ?

