We are now entering the 3rd longest economic expansion since World War II. The growth of the last 12 months, however, came in at the slowest pace since the recessionary transition year of 2009.
Specifically, gross domestic product (GDP) for calendar year 2016 was only 1.6%. And it is the third time since the financial collapse that annual economic growth sank below 2%.
Keep in mind, when economic weakness threatened to derail financial markets in 2011 as well as 2013, central banks came to the rescue with monetary stimulus. In 2011, the Federal Reserve served up “Operation Twist,” while the European Central Bank (ECB) pledged to implement a “three-pronged debt deal” to bolster the euro-zone. By 2013, the Fed had already ushered in one of its largest iterations of electronic money creation via “QE3.”
Today? The ECB is already discussing a slowdown for its asset purchasing program(s) and the Fed plans to further tighten its reins, through hikes to its overnight lending rate as well as possibly selling bonds on its balance sheet. In other words, central banks are tightening, not stimulating, at the same time that the U.S. economy is cooling.
It is worth noting that central bank tightening campaigns that became part of the first terms of previous presidencies (e.g., Reagan, G.H.W. Bush, G.W. Bush, etc.) are inextricably linked with significant stock market declines. A bear market descent of 24% on the Dow rocked Reagan in 1981-1982. A 21% fall from grace for the Dow late in 1990 plagued G.H.W. Bush. Most notably, the tech wreck that sent the S&P 500 down by 50% in 2000-2002 is tied to rapid-fire rate hikes in 1999, haunting the younger Bush straight from the get-go.
In spite of the obvious headwinds for investors – higher borrowing costs, less Fed stimulus, an economy that has been slowing – stocks have been setting records. Many have determined that Trump’s prescriptions for the anemic eight-year recovery can only help public corporations as well as the middle class labor force. Believers had pushed the Dow beyond a symbolic 20,000 level.
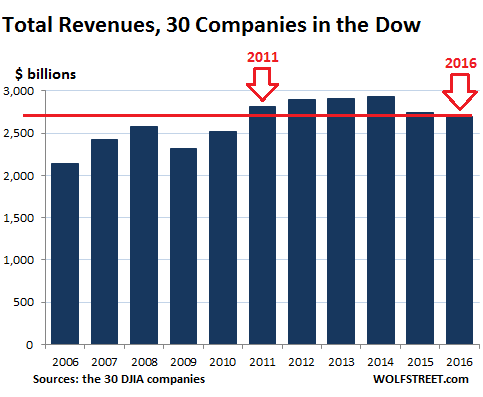
Is it really true that the new administration will benefit companies and employees enough to justify exorbitant valuations? As Wolf Richter points out, the aggregate revenue for the 30 companies in the “right-now” Dow is $2.69 trillion. Revenues are lower than they were in 2011. Yet investors push the price of the Dow north of 20,000? Why are so many content to pay 2016 prices for 4.4 % LESS revenue (sales) than occurred in 2011? Note: The Dow Jones Industrials finished 2011 at 12,217.

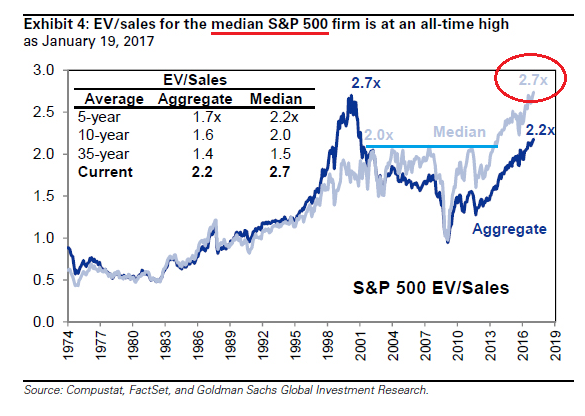
The case for the S&P 500 near 2300 is equally perplexing. The median stock in the S&P 500 has never been more overpriced on an enterprise value-to-revenue basis (EV/sales). Whereas EV/Sales came in near its 10-year average at 2.0 in 2011, it is currently at 2.7 today. At no point in history has the median stock in the S&P 500 been this far out of whack; the S&P 500 had been ascending for years irrespective of flat and/or declining revenue.

What it all seems to come down to, then, is blind faith. The only thing that matters is that Trump’s plans (i.e., deregulation, tax cuts, health care reform, trade renegotiation, infrastructure spending, etc.) can overcome overvalued equity pricing as well as Fed policy tightening.
I’m not sure this will be the case. Take the administration’s intention to place tariffs on Mexican imports and Chinese imports. Wouldn’t this increase the price that consumers pay for previously cheap food products, clothing and even oil? In an economy where GDP is 70% driven by the American consumer, it seems we might have less purchasing power.
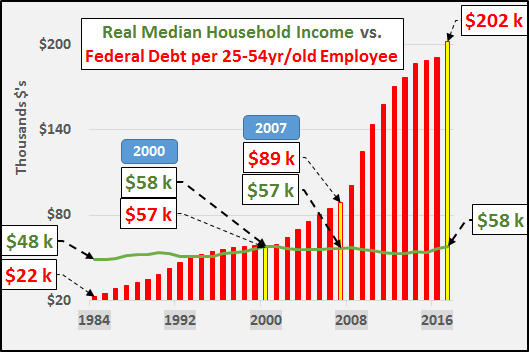
Similarly, there might be widespread agreement on both sides of the aisle that crumbling infrastructure needs to be upgraded. And perhaps Trump can negotiate private funding for some of it. Nevertheless, there will obviously be some component paid for by the public. With $20 trillion already on the books – with the administration inheriting $1 trillion in existing obligations – how much more borrowing from the future can the country genuinely tolerate?

Perhaps obviously, greed and fear move markets. The absence of fear has been evident in the recent multi-year lows in the CBOE S&P 500 Volatility Index (VIX). Greed? The euphoria has spread to magazine/newspaper covers like “Next Stop: Dow 30,000.”
On the other hand, these are the same types of indications that preceded major tops in equity pricing. One of my favorites ever? Smart Money magazine, a popular Dow Jones publication between 1992 and 2012, gave us a gem at the record high for the NASDAQ in March of 2000. They served up “What’s next for the market’s hottest sector – and how to profit from it.” They provided the “Ultimate Tech Portfolio” of 15 stocks for a diversified and profitable future. Seventeen years later, those tech stocks (some no longer exist) are still collectively down as much as 75%!
Even the notion that the Dow’s 20,000 feat is special ought to be scrutinized by savvy equity investors. For example, on an inflation-adjusted basis, the Dow is up just 19% over the 16 years of the 21st century. (The NASDAQ is down about 28% in real terms).
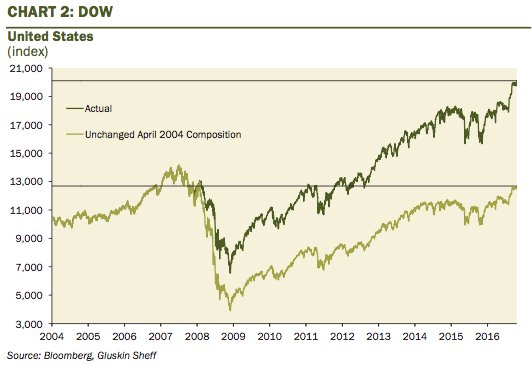
But wait… there’s more. Neither the Dow nor the NASDAQ would be anywhere close to recapturing a prize were it not for the changes made to the index components themselves.
Sam Ro of Business Insider demonstrated that the Dow would be sitting at 13,000 were it not for putting in and pulling out different companies from the Dow. Note: Am I the only one that finds it fascinating that Dow 13,000 would actually be closer to the fair value represented by the price-to-revenue (P/S) and EV/revenue (sales) described earlier in my commentary?

I remain hopeful by “some” of the administration’s intentions. Tax reform. Less regulation. Still, I do not believe that it will be possible to “trump” the history of Fed tightening and the history of business cycles. Equally worthy of note, one cannot expect that the President will be able to maintain all of the entitlement spending, substantially lower revenue (taxes), dramatically increase infrastructure outlays, increase spending in other areas such as defense and the border wall, without significant push-back from budget conscious Congressional participants. None of these issues even account for potential fallout from trade renegotiation.
Bottom line? Sensible risk taking involves acquiring assets at reasonable prices. Moreover, if one does not have a mechanism for a substantial replenishment of cash reserves (e.g., earned income, other sources of income, etc.), smart investors reduce the risk of growth assets like stocks by selling some of them when circumstances dictate. Those circumstances? Economic cycle deterioration, asset valuation extremes, monetary policy tightening, inflationary pressures, financial instability and/or political unpredictability.
Disclosure: Gary Gordon, MS, CFP is the president of Pacific Park Financial, Inc., a Registered Investment Adviser with the SEC. Gary Gordon, Pacific Park Financial, Inc, and/or its clients June hold positions in the ETFs, mutual funds, and/or any investment asset mentioned above. The commentary does not constitute individualized investment advice. The opinions offered herein are not personalized recommendations to buy, sell or hold securities. At times, issuers of exchange-traded products compensate Pacific Park Financial, Inc. or its subsidiaries for advertising at the ETF Expert web site. ETF Expert content is created independently of any advertising relationships.
