The market just saw a drop of 7.6% in a single day. This isn’t something that’s normal or an environment many traders are used to being in. There’s been just a handful of such large moves, where stocks get blown out, sentiment tanks, and investors are left with a large question mark above their heads, wondering what happens next. I’ve blogged several times since the sell-off began that the data wasn’t supportive of a low just yet. First it was because of Volatility being persistently elevated and then because the sentiment spread as of last Friday was extremely wide, both develops historically occur BEFORE a bottom, not at one. Many other market commentators, technicians, and traders disagreed and that’s okay.
Last night I sent out a letter to Thrasher Analytics subscribers with analysis of what transpired yesterday along with my opinions going forward. One paragraph of that letter looked at the historical precedent of massive one-day declines in U.S. equities. I’m going to expand on that topic today.
Since 1987, there have been 14 single-day declines of at least 6% in the S&P 500. Although it’s a small sample size, the historical average is for the index to be higher rough 3-months later 64.3% of the time and was higher 85.7% of the time just one week later. In the first chart below you can see each a line representing each decline and the resulting price move of the following five days.
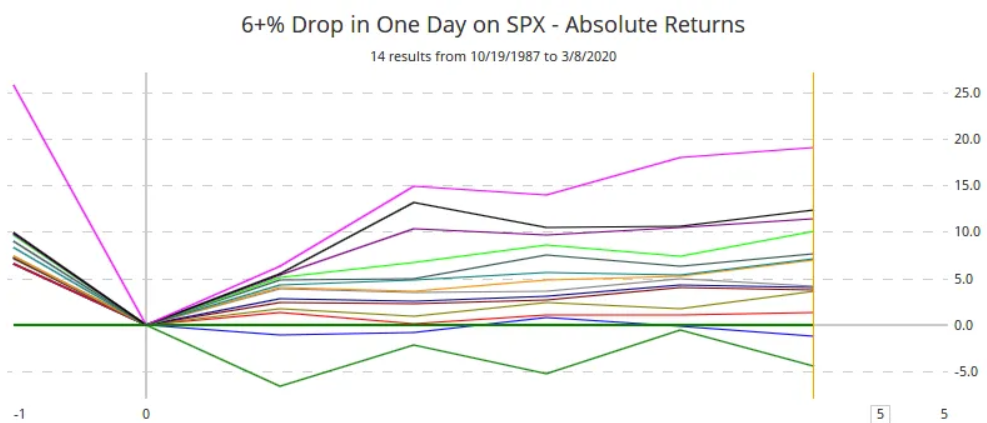
These large declines are often associated with capitulation in the financial markets. To see that level of panic selling, a major market stress often occurs with a last gasp of bullishness being exhaled into the close. Few bulls remain standing after a day like that and when there’s too few buyers, that’s what can send stocks moving higher (don’t you love it?).
Let’s look at some of these massive declines, shall we? On the charts I’ve included the Daily Sentiment Index to show how sour sentiment turns on days like these and how it compares to present day. For the record, The % bullish reading for Monday was just 5% for the S&P 500 (noted by the green line on each of the charts) and 4% for the Nasdaq 100.
2011
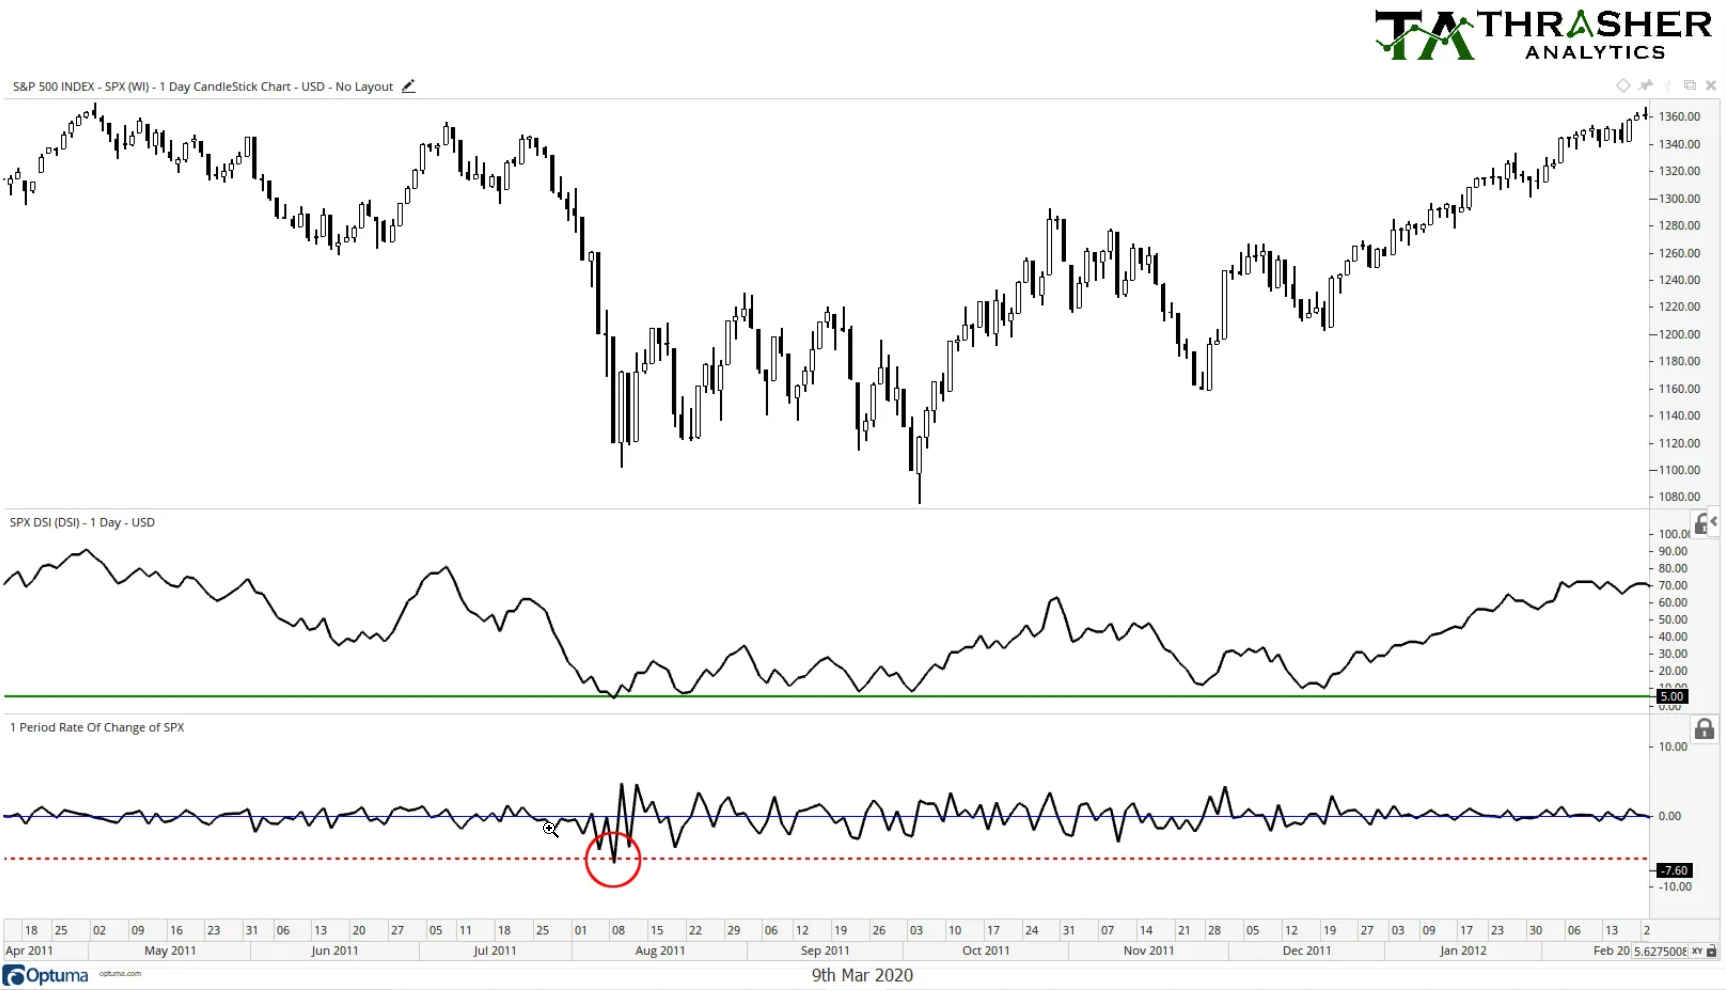
First on our journey back to major one-day declines is August 2011. We saw a 6+% decline, sentiment dropped to 4% bullish and stocks began to whipsaw for a few days before a counter-trend rally and a test of the initial low.
2008
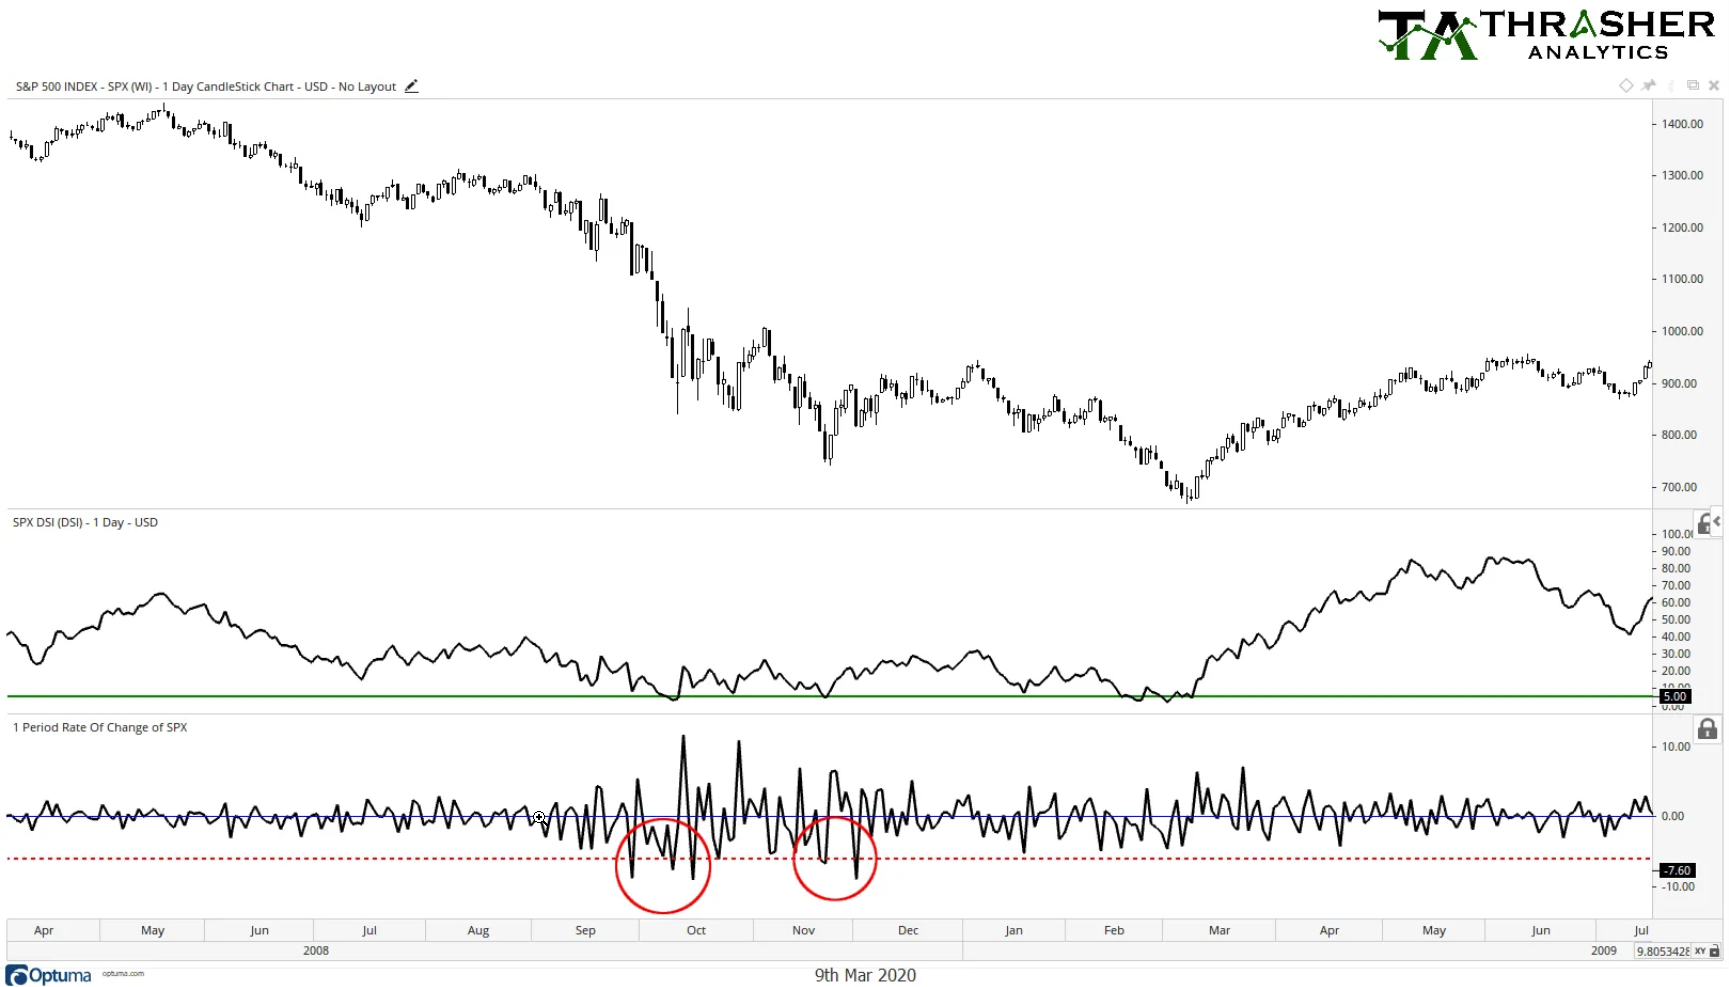
Several days in September through December saw 6+% daily declines. October and November saw a few brief counter-trend rallies, but stocks continued to move lower to finish out the bear market the following year.
1998
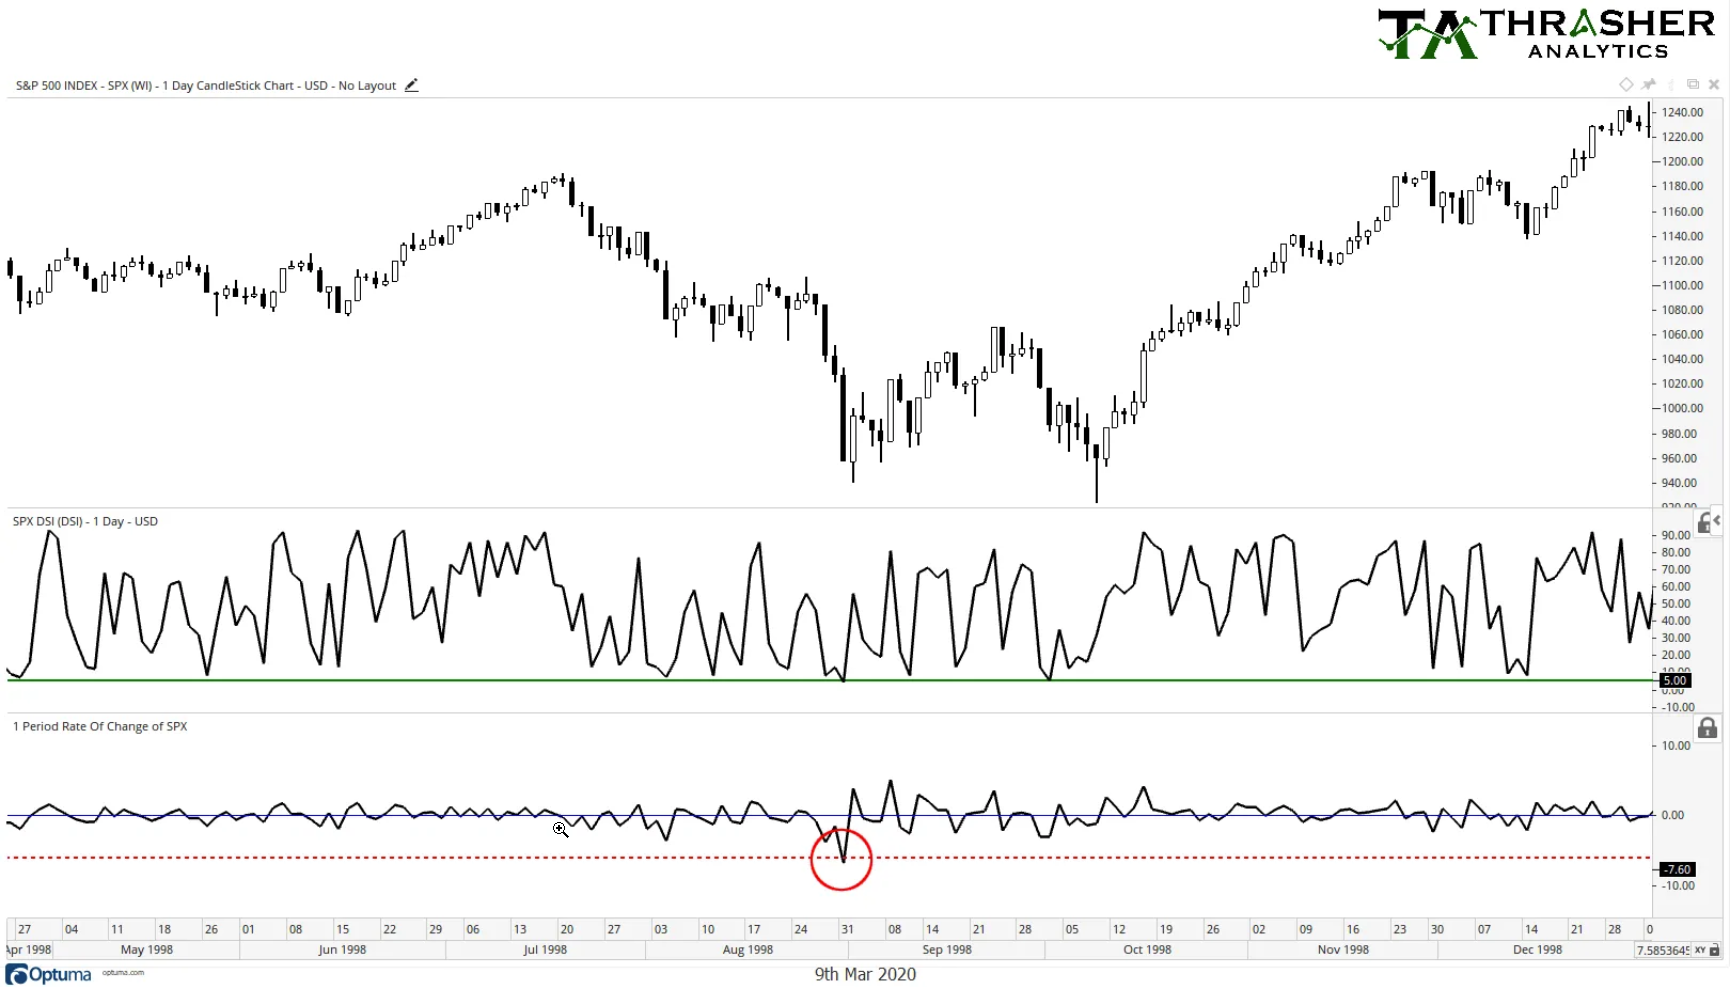
Similar to today, the 1998 decline was a result of global issues and saw a single-day drop of 6% and sentiment fall to the floor. Stocks once again rallied and then tested the low before moving higher into year-end.
1997
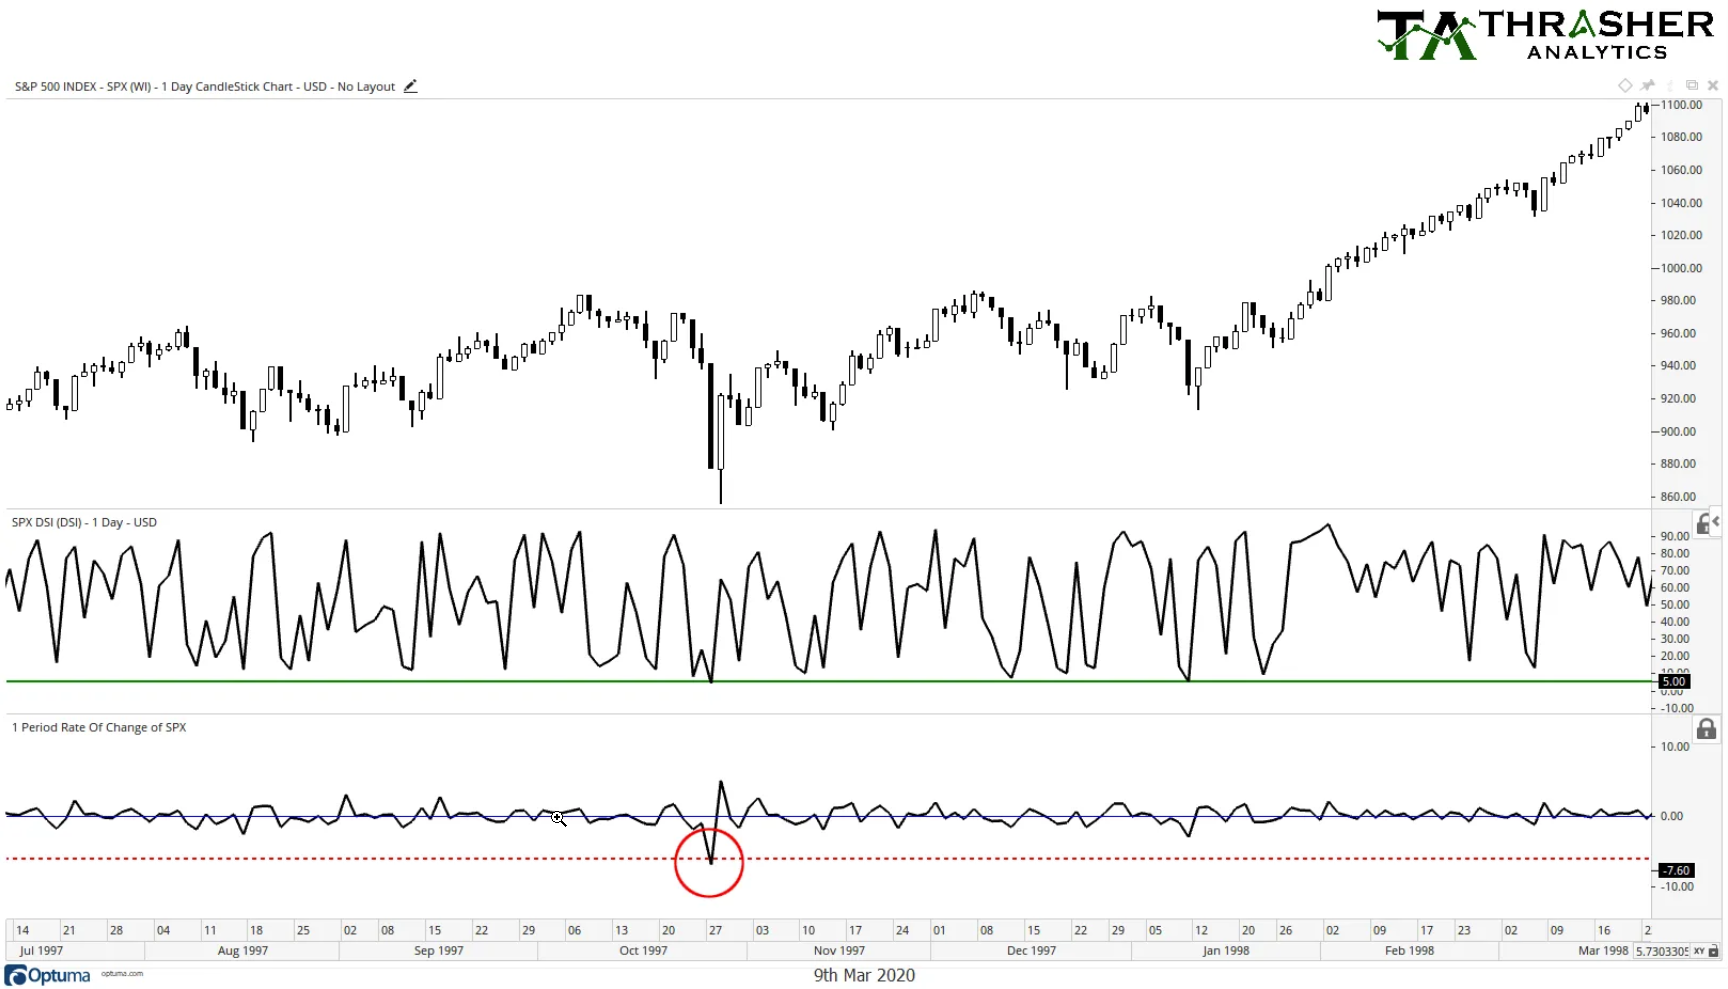
On October 27, 1997 the S&P saw a large decline that sent sentiment to 5% bullish. The next day produced a 5% snap-back rally with stocks continuing higher from there.
1989
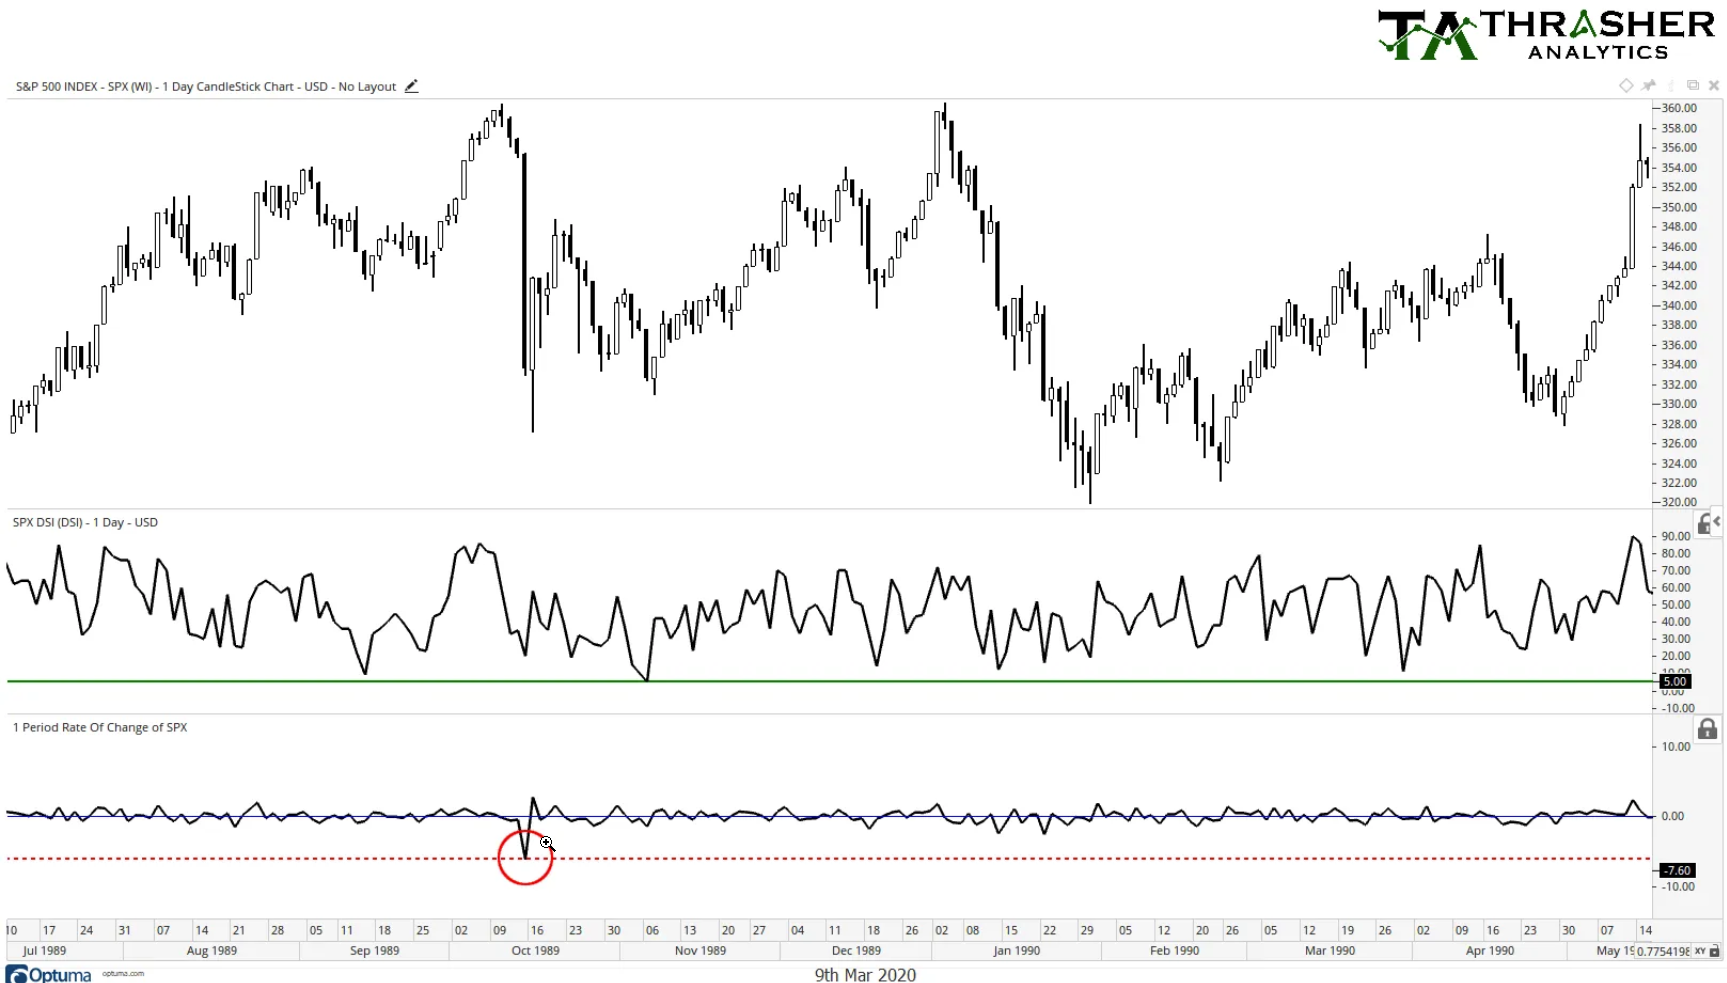
In October 1989 the S&P 600 dropped 6% then rose nearly 3% as it produced a counter-rally only to see stocks some days later fall back to test the first low. A multi-month move higher then followed until stocks began to weaken once again at the start of 1990.
1988 And 1987
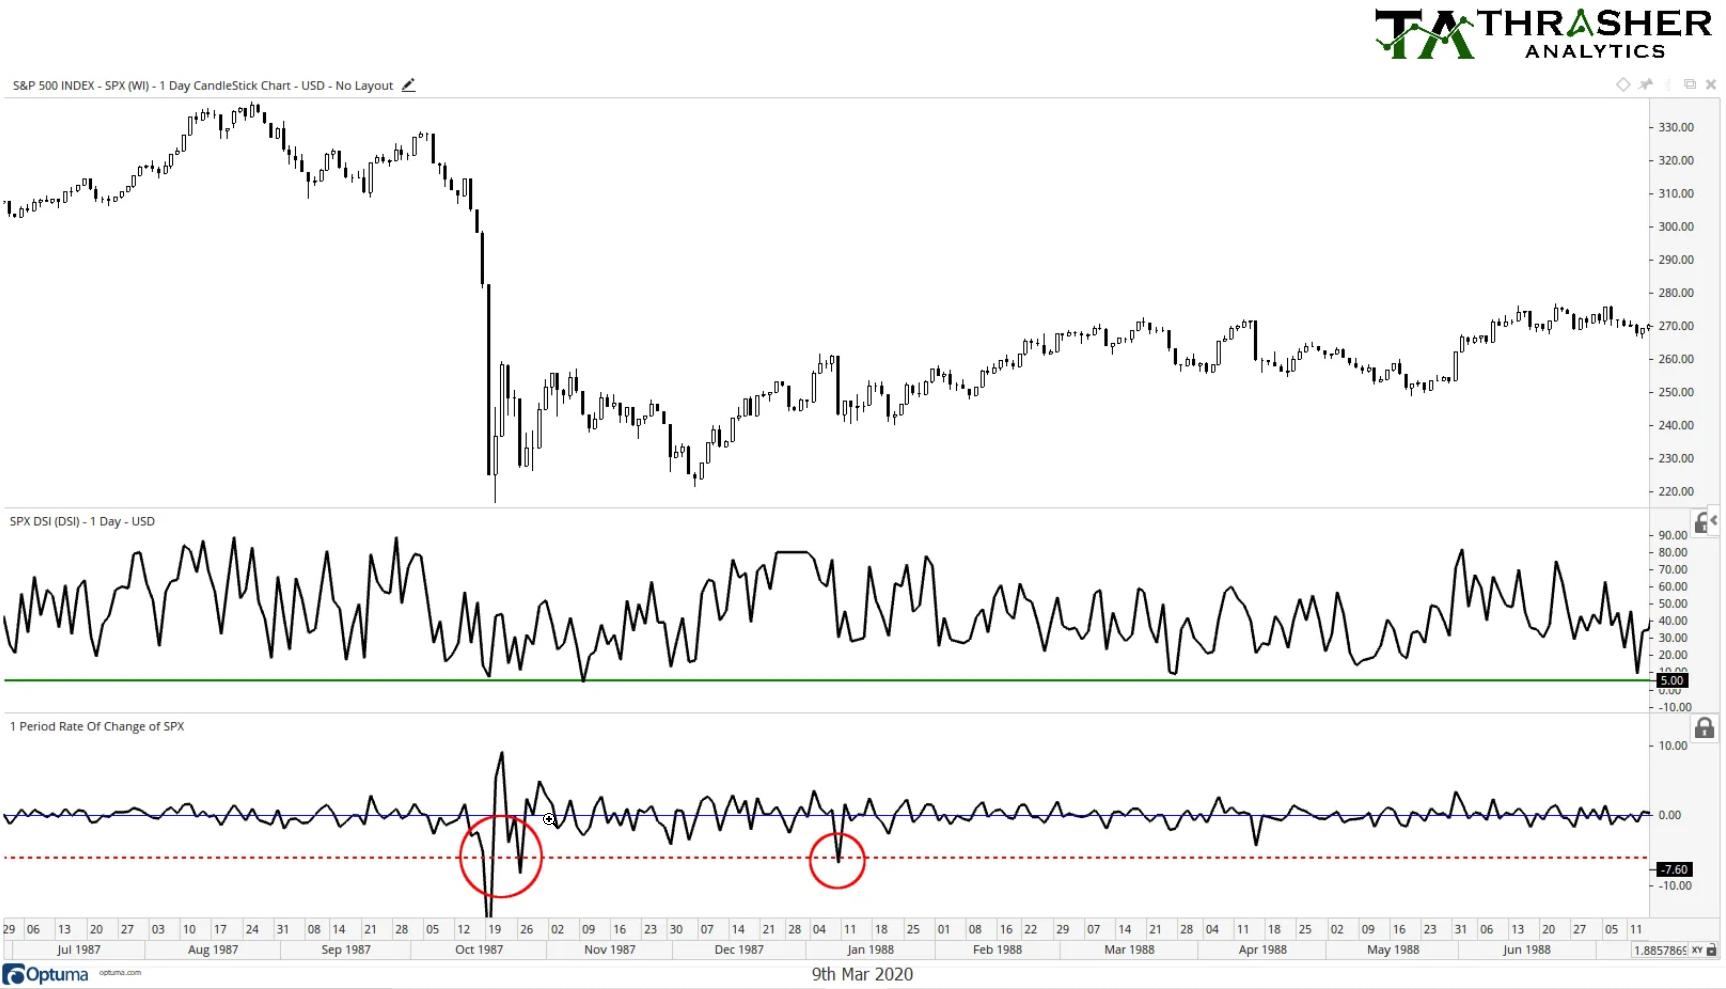
This period is one that goes down in the history books. First, we had Black Monday and a 20% drop in equities, followed a big bounce and then another 6+% drop before stocks trading mostly sideways until testing that Black Monday low. Then in January 1988 another large one-day loss was incurred but sentiment held firm that day, north of 20% bullish and stocks put in a brief rally before testing that large day low.
Do You See A Theme Here?
Sentiment gets destroyed and moves to 4-5% when the equity index falls by at least 6%, we then have rallied which often failed and the initial low gets tested. Most (but not all!) large-day losses followed this or a similar pattern. Of course there’s not a requirement for price to follow this historical pattern but I believe it’s helpful to understand what price has done in the past in similar situations, which is what the above charts show. Will we see today’s market repeat such a playbook? We’ll see.
