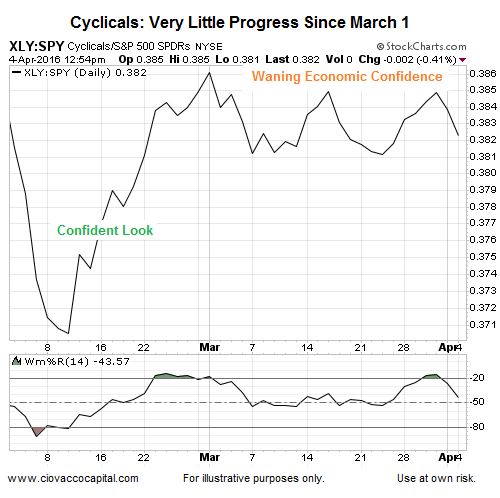
We can learn a lot from the chart below, which shows the performance of economically-sensitive stocks relative to the S&P 500. After the S&P 500 bottomed on February 11, cyclicals (Consumer Discretionary Select Sector SPDR (NYSE:XLY)) took the lead off the low as economic confidence started to improve. Notice the steep slope of the ratio off the recent low (see green text). The confident look has morphed into a more concerning look as the S&P 500 (via SPDR S&P 500 (NYSE:SPY)) has continued to rise over the last month (orange text), which tells us to keep an open mind about a pullback in the stock market.
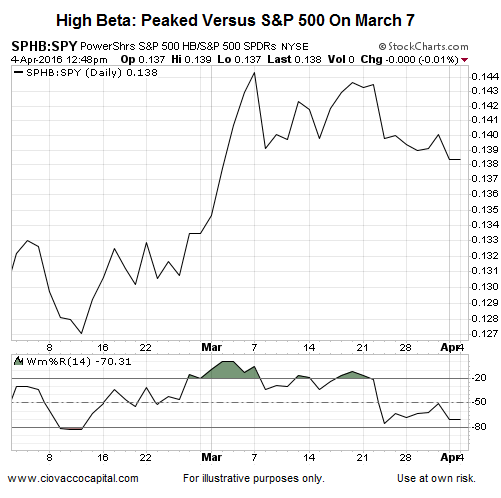
A similar picture emerges when we examine the high beta stocks (Powershares S&P 500 High Beta Portfolio (NYSE:SPHB)) to S&P 500 ratio below.
What Can We Learn From The Longer-Term View?
This week’s stock market video examines the question:
What can we learn from asset class behavior?
The video covers low beta stocks (Powershares S&P 500 Low Volatility Portfolio (NYSE:SPLV)), consumer staples (Consumer Staples Select Sector SPDR (NYSE:XLP)), Treasuries (iShares 20+ Year Treasury Bond (NYSE:TLT)), high-yield bonds (SPDR Barclays (LON:BARC) High Yield Bond (NYSE:JNK)), the NASDAQ (PowerShares QQQ Trust Series 1 (NASDAQ:QQQ)), Dow (SPDR Dow Jones Industrial Average (NYSE:DIA)), NYSE Composite Stock Index (Vanguard Total Stock Market (NYSE:VTI)), VIX (iPath S&P 500 VIX Short-Term Futures Exp 30 Jan 2019 (NYSE:VXX)), crude oil (US Oil Fund (NYSE:USO)), emerging markets (iShares MSCI Emerging Markets (NYSE:EEM)), transportation (iShares Transportation Average (NYSE:IYT)), energy (Energy Select Sector SPDR (NYSE:XLE) ), and materials (iShares US Basic Materials (NYSE:IYM)).
Back To The Shorter-Term Charts
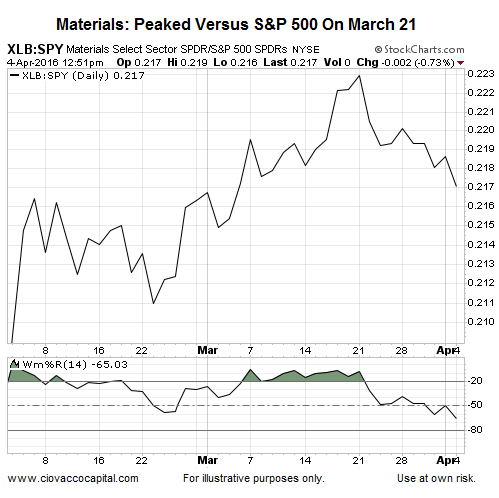
The economically-sensitive materials sector (Materials Select Sector SPDR (NYSE:XLB)) has significantly lagged the S&P 500 over the past two weeks.
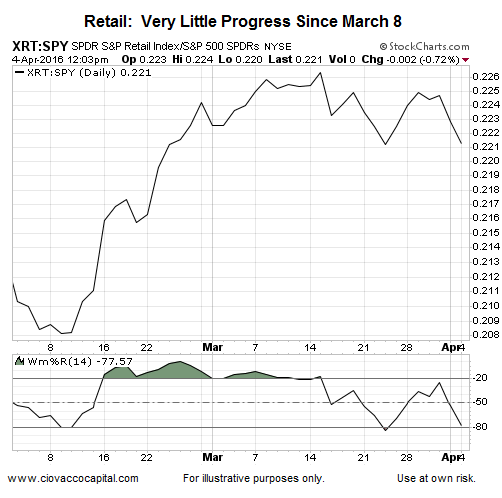
Given the consumer is often referred to as the lifeblood of the U.S. economy, the tepid relative performance of the SPDR S&P Retail ETF (NYSE:XRT) since March 8 is a bit concerning.
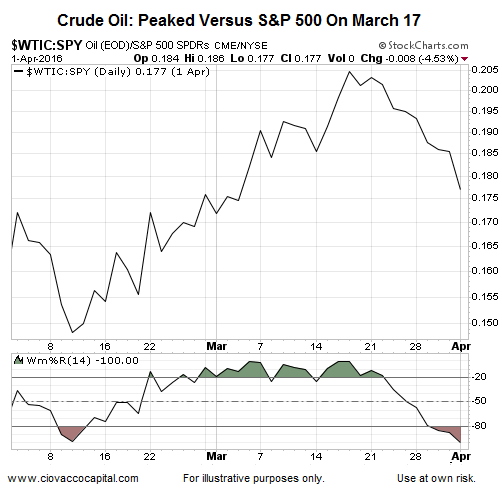
If problems return to the oil patch, problems may return in the credit markets. Oil peaked relative to the S&P 500 over 2 weeks ago.
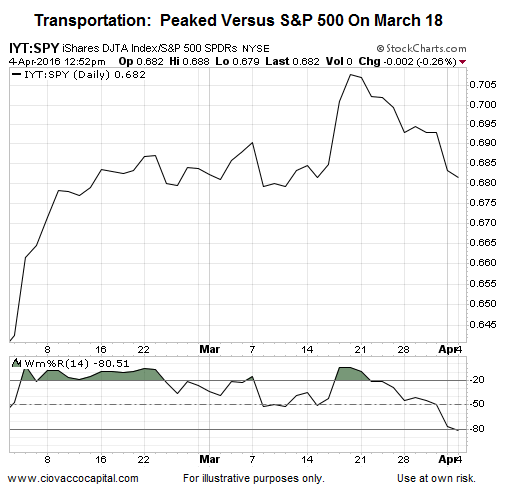
Transportation stocks have made little to no progress relative to the broader stock market since early March.
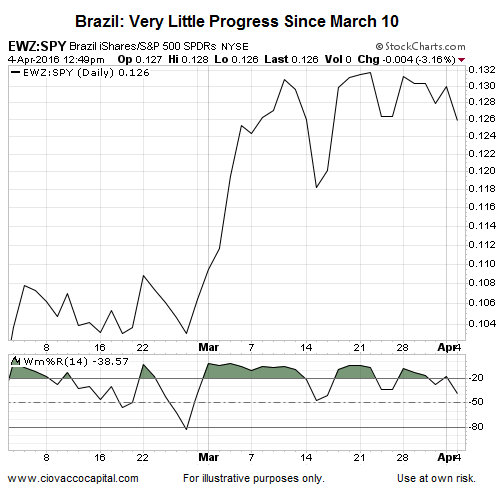
Brazil (iShares MSCI Brazil Capped (NYSE:EWZ)) has been one of the best performing ETFs since late January 2016. As shown in the EWZ/SPY chart below, the ratio has stalled in recent weeks.
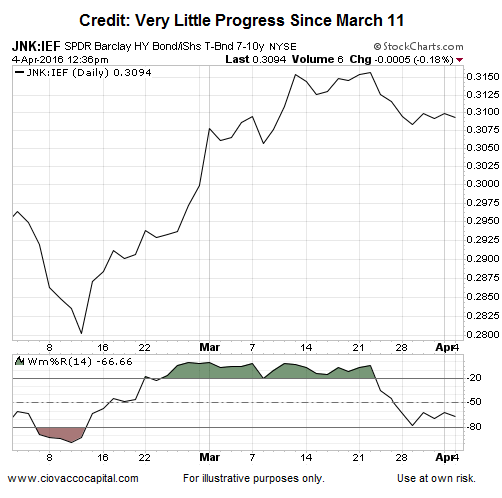
If credit leads stocks, then the chart below tells us confidence in the current stock market rally may be waning.
