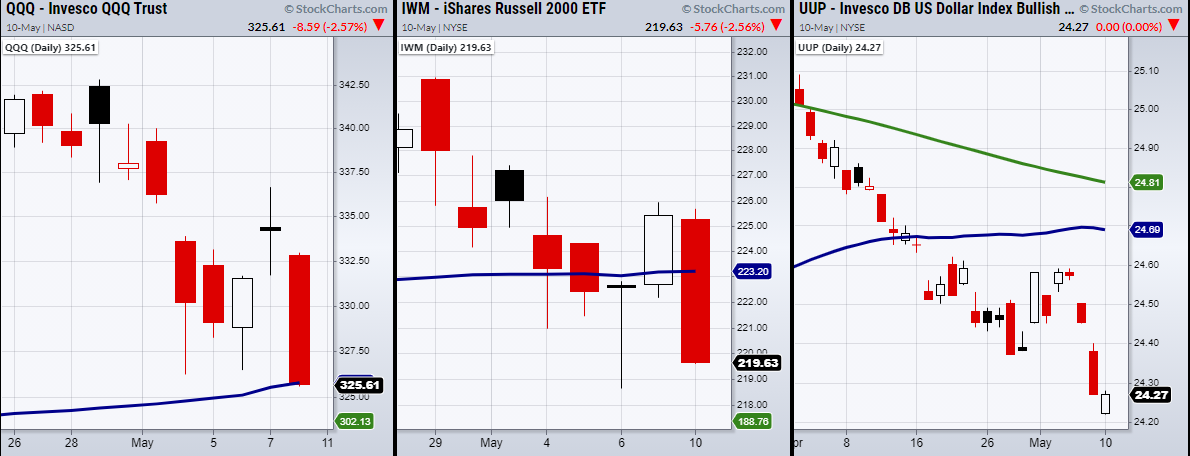
The Russell 2000—iShares Russell 2000 ETF (NYSE:IWM) and the NASDAQ 100's Invesco QQQ Trust (NASDAQ:QQQ) both broke their 50-Day moving averages on Monday.
Meanwhile, Transportation—iShares Transportation Average ETF (NYSE:IYT)—printed another new all-time high. This shows the market's current indecision and choppy nature.

The market's uncertainty may be related to inflation that is set to increase beyond 2% going into 2022.
Another factor within the inflation realm is the decreasing value of the US dollar—Invesco DB US Dollar Index Bullish Fund (NYSE:UUP)—which was not far from this year’s all-time low at $24.05.
It can be debated historically that a weakening dollar does not contribute to rising inflation as in the past, countries that export to the U.S. have a fair amount of competition and could eat the cost of a weaker dollar for the benefit of doing business with the U.S.
So why is this time different?
Not only does the U.S. have 28-trillion dollars of debt, but it is also looking to add even more.
However, the biggest move in UUP will come first from a shift in investor's sentiment as they perceive the U.S. dollar as a weakening currency.
This is how the dollar could move lower as investors turn away U.S. issued bonds looking for safer places to park their money. Additionally, if the dollar becomes weak enough, it could be tempting for enough countries to increase their export prices.
With that said, this is a long-term trend that has yet to unfold but should not be taken out of the picture, especially if the dollar continues to trend lower.
ETF Summary
- S&P 500 SPY) Broke the 10-DMA at 418.10.
- Russell 2000 (IWM) Next support area from 217 -218.50.
- Dow (DIA) 342.43 main support area.
- NASDAQ (QQQ) Broke 325.87 the 50-DMA.
- KRE (Regional Banks) 71.53 resistance. Next Support from the 10-DMA at 69.53.
- SMH (Semiconductors) Needs to hold over 232.80 support.
- IYT (Transportation) Nearest support the 10-DMA at 273.10.
- IBB (Biotechnology) Support at 146.86.
- XRT (Retail) 92.21 recent low is next support level.
- Volatility Index (VXX) 38.88 resistance.
- Junk Bonds (JNK) 108.56 support.
- XLU (Utilities) Resistance at 67.38.
- SLV (Silver) 24.74 support.
- VBK (Small Cap Growth ETF) 269.80 pivotal area.
- UGA (US Gas Fund) 34.68 resistance area.
- TLT (iShares 20+ Year Treasuries) Second close under the 50-DMA at 138.15 will confirm a bearish phase.
- USD (Dollar) 90.00 support.
- MJ (Alternative Harvest ETF) 20.16 new support.
- LIT (Lithium) 61.28 support.
- XOP (Oil and Gas Exploration) Like to see this hold over 85.14.
- DBA (Agriculture) 18.74 support.
