NVDA Q3 Earnings Alert: Why our AI stock picker is still holding Nvidia stockRead More

What A Bull Market Looks Like

Published 12/22/2016, 11:22 AM
Updated 05/14/2017, 06:45 AM
US500
-
DJI
-

When the term 'Bull Market' is mentioned, it's often the Wall Street statue that comes to mind. The statue looks strong, aggressive and focused. And that's not a bad definition of a bull market: strong, aggressive and focused. But sometimes it can be hard to see that through all the day-to-day noise. How can this be a bull market if the Dow Jones Industrial Average can’t manage to break 20,000? Or if valuations are stretched? Or famous managers are ‘going to cash’?

It is the noise that kills your portfolio. All of these examples are just opinions of the state of the market and where it will go. The one and only piece of information that matter though is what the indexes are actually doing. In a bull market they are going up. We could argue how high the markets need to go to be considered a bull market but let’s keep it simple for now. Up = bull.

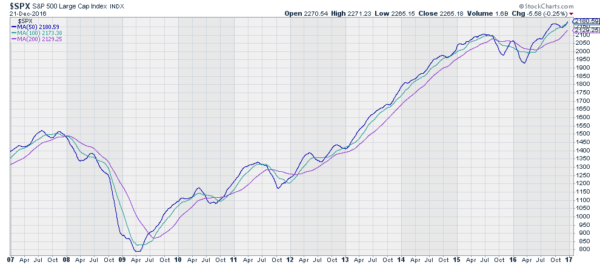
S&P 500 With 50-, 100- And 200-Day Simple Moving Averages

But even that definition can yield confusion. To borrow from President Bill Clinton’s testimony, with some leeway, it depends on what your definition of ‘up’ is. Prices move up and down all the time and can change day to day and intraday. So what is up? We can simplify that, too, by looking at smoothed price data, like in the chart above. The 3 lines in the chart show the 50-, 100- and 200-day simple moving averages for the S&P 500. By averaging price over 50, 100 or 200 trading days, the noise gets washed out.

What, then, does this chart say about the market? Since 2009, there has been a strong, bullish trend higher, interrupted by 3 periods of pause or downward action. The first was in mid 2010, the second in mid 2011 and the third was the longest from mid 2015 to the 2nd Quarter of 2016. Since then, the moving averages have all been running higher. That's a Bull market. So push aside the noise and ride it higher.

Latest comments

Loading next article…
Risk Disclosure: Trading in financial instruments and/or cryptocurrencies involves high risks including the risk of losing some, or all, of your investment amount, and may not be suitable for all investors. Prices of cryptocurrencies are extremely volatile and may be affected by external factors such as financial, regulatory or political events. Trading on margin increases the financial risks.
Before deciding to trade in financial instrument or cryptocurrencies you should be fully informed of the risks and costs associated with trading the financial markets, carefully consider your investment objectives, level of experience, and risk appetite, and seek professional advice where needed.
Fusion Media would like to remind you that the data contained in this website is not necessarily real-time nor accurate. The data and prices on the website are not necessarily provided by any market or exchange, but may be provided by market makers, and so prices may not be accurate and may differ from the actual price at any given market, meaning prices are indicative and not appropriate for trading purposes. Fusion Media and any provider of the data contained in this website will not accept liability for any loss or damage as a result of your trading, or your reliance on the information contained within this website.
It is prohibited to use, store, reproduce, display, modify, transmit or distribute the data contained in this website without the explicit prior written permission of Fusion Media and/or the data provider. All intellectual property rights are reserved by the providers and/or the exchange providing the data contained in this website.
Fusion Media may be compensated by the advertisers that appear on the website, based on your interaction with the advertisements or advertisers.
© 2007-2024 - Fusion Media Limited. All Rights Reserved.