Markets return to normal service today following the Easter long weekend. I trust that you used your time away from the charts wisely and used the downtime to refresh your body and mind.
Knowing when to take a break is an essential psych aspect of forex trading and can do wonders for maintaining your positive P&L. If you ever find yourself taking dumb trades because your head just isn’t in the game, step away and return when your head is clear. Simple solution.
During thin trading conditions such as holiday Friday and Monday, markets can either go mental and whipsaw like crazy, or markets can peter out and do nothing. This weekend was most definitely the second option, with Forex markets all basically back where they started and nothing too exciting to report in the short term.
US stocks did trade yesterday, but it’s this higher time frame level that indices traders will be watching with interest:
S&P 500 Weekly: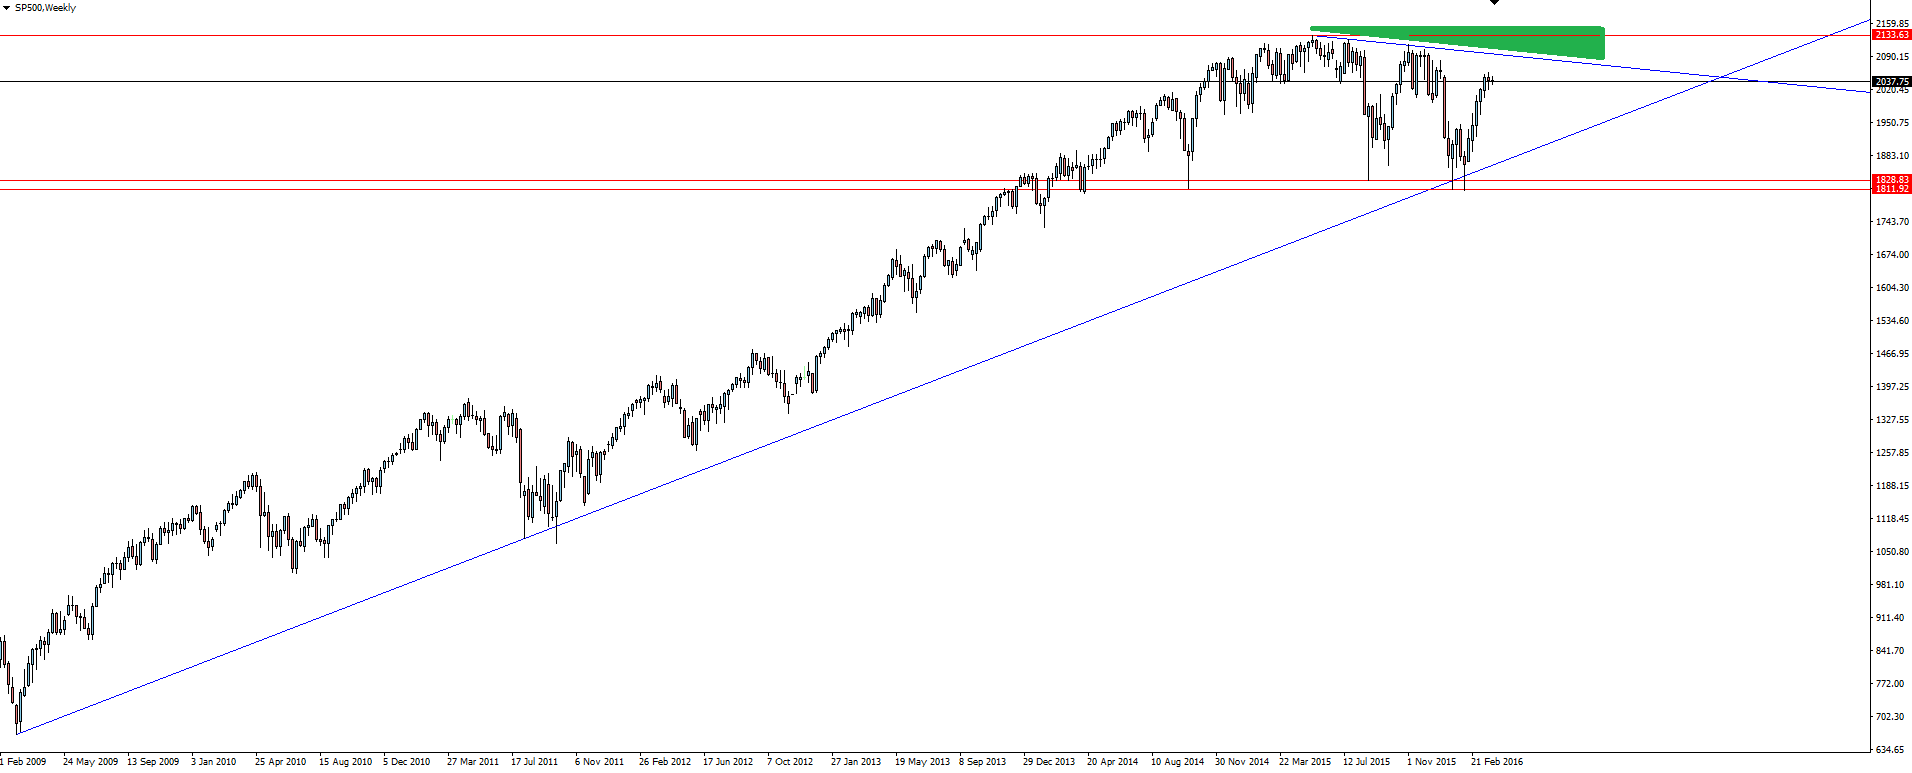
Click on chart to see a larger view.
With major trend line support across Indices holding, price has rallied hard away from the level. This means that our breakout lower scenario was never given a chance and as the S&P 500 price approaches the top of the range, attention turns to this level instead.
The marked green zone will be the area of interest for sellers and in the short term at least, fading into that level shouldn’t give you too many problems.
SPI200 Weekly: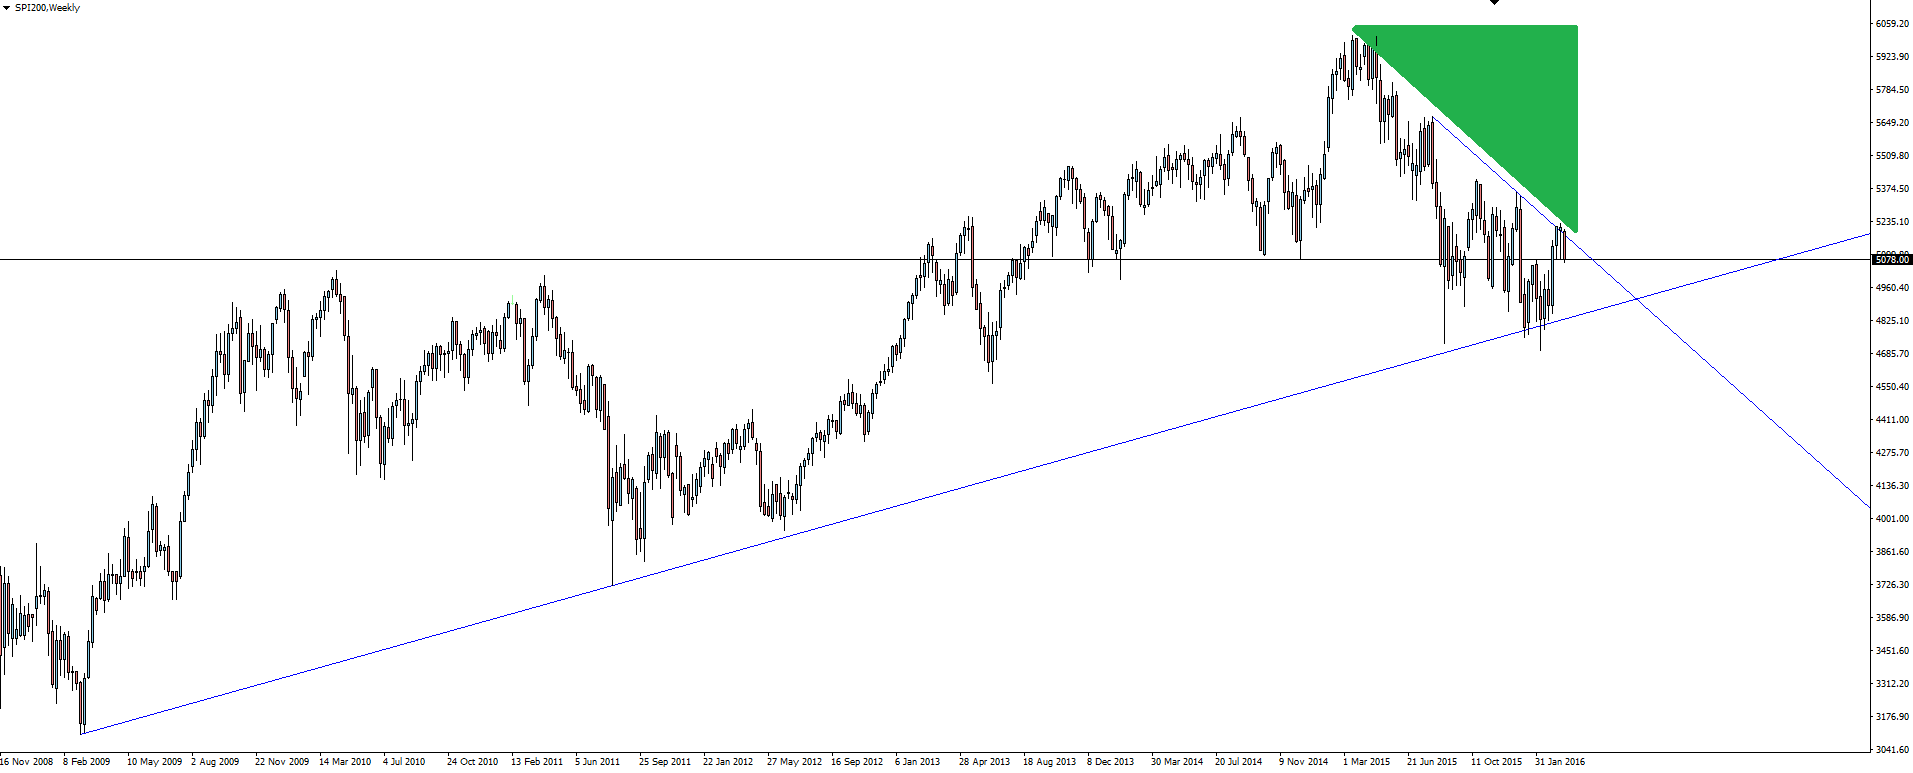
Click on chart to see a larger view.
The Australian SPI 200 has the same characteristics as it’s big brother across the Pacific, but hasn’t managed to come anywhere near its previous highs. With trend line resistance still there, we have the same type of setup in play on this market as well.
Whenever you have a technical setup on the S&P 500 chart, take a look at all of the other Indices markets and quite often, at least the same type of setup will be there.
Yellen speaks tonight and we have NFP on Friday. Futures markets have priced in just a 6% chance of a hike in April, but Fed speakers have done all they can to keep us confused as to what they actually want to do with rates. Speaking on direction here would be nothing but a punt, but the greater risk is for a violent USD move to the upside if things suddenly get hawkish in reality and markets have to go through a big repricing from expectations.
Chart of the Day:
The one forex chart that has caught my eye is the kiwi.
NZD/USD Weekly:![]()
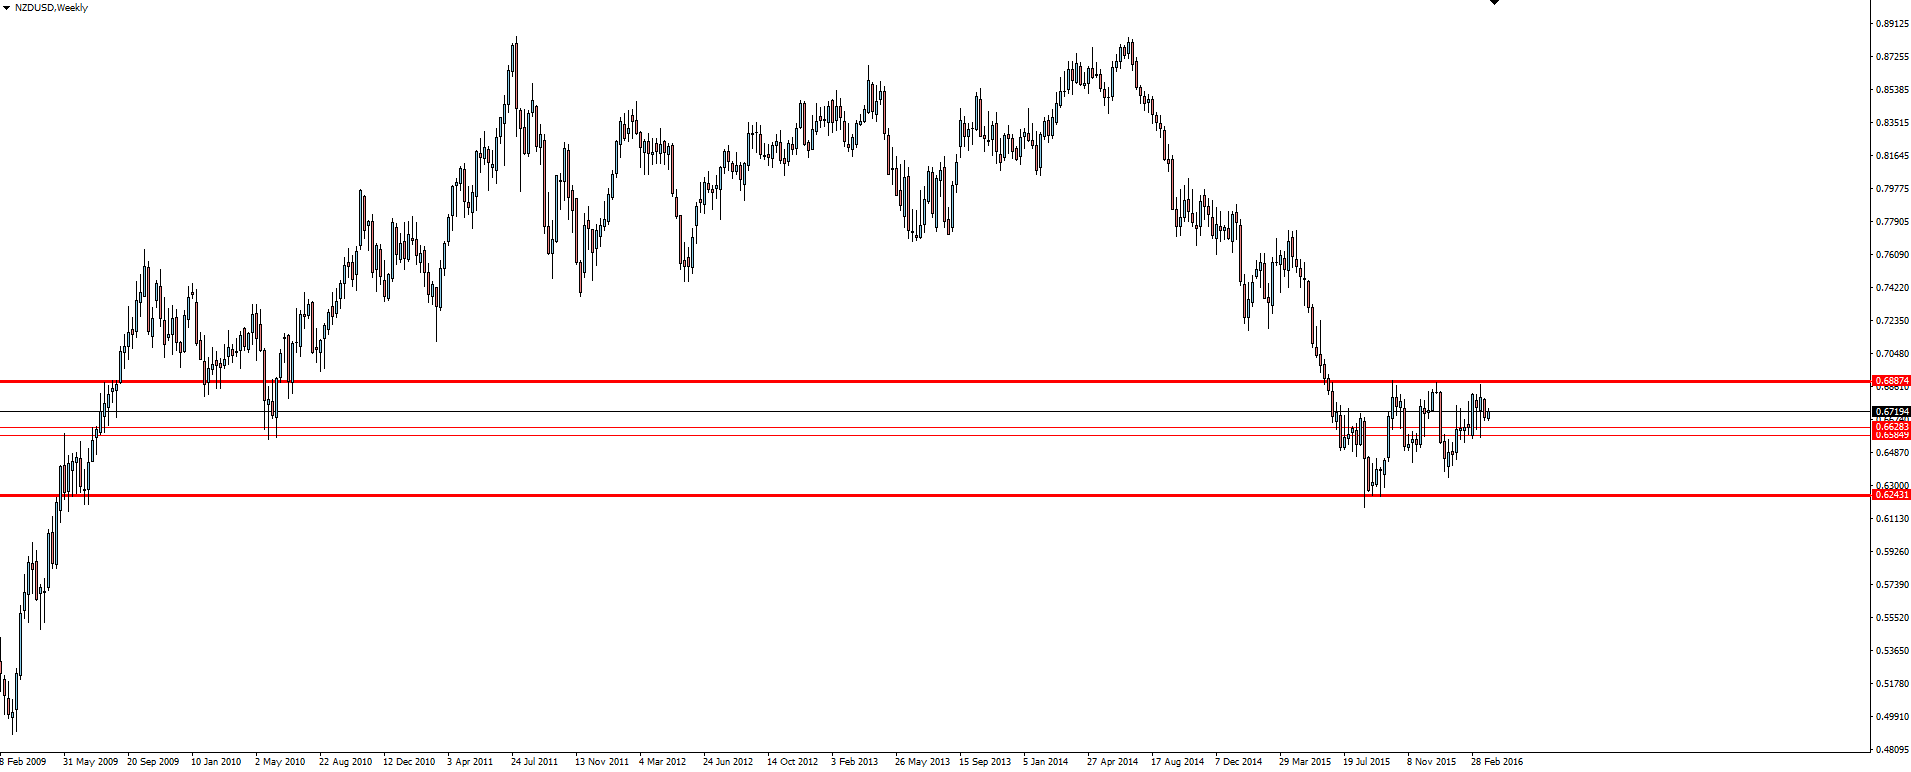
The NZD/USD weekly chart shows that the Kiwi is actually in some sort of ‘fair value zone’ here. Yes, that is a 600 pip zone which for many of us day traders is pretty useless as a trading level alone, but you have to train your mind to realise that the higher time frame levels aren’t for using alone.
NZD/USD 4 Hourly:
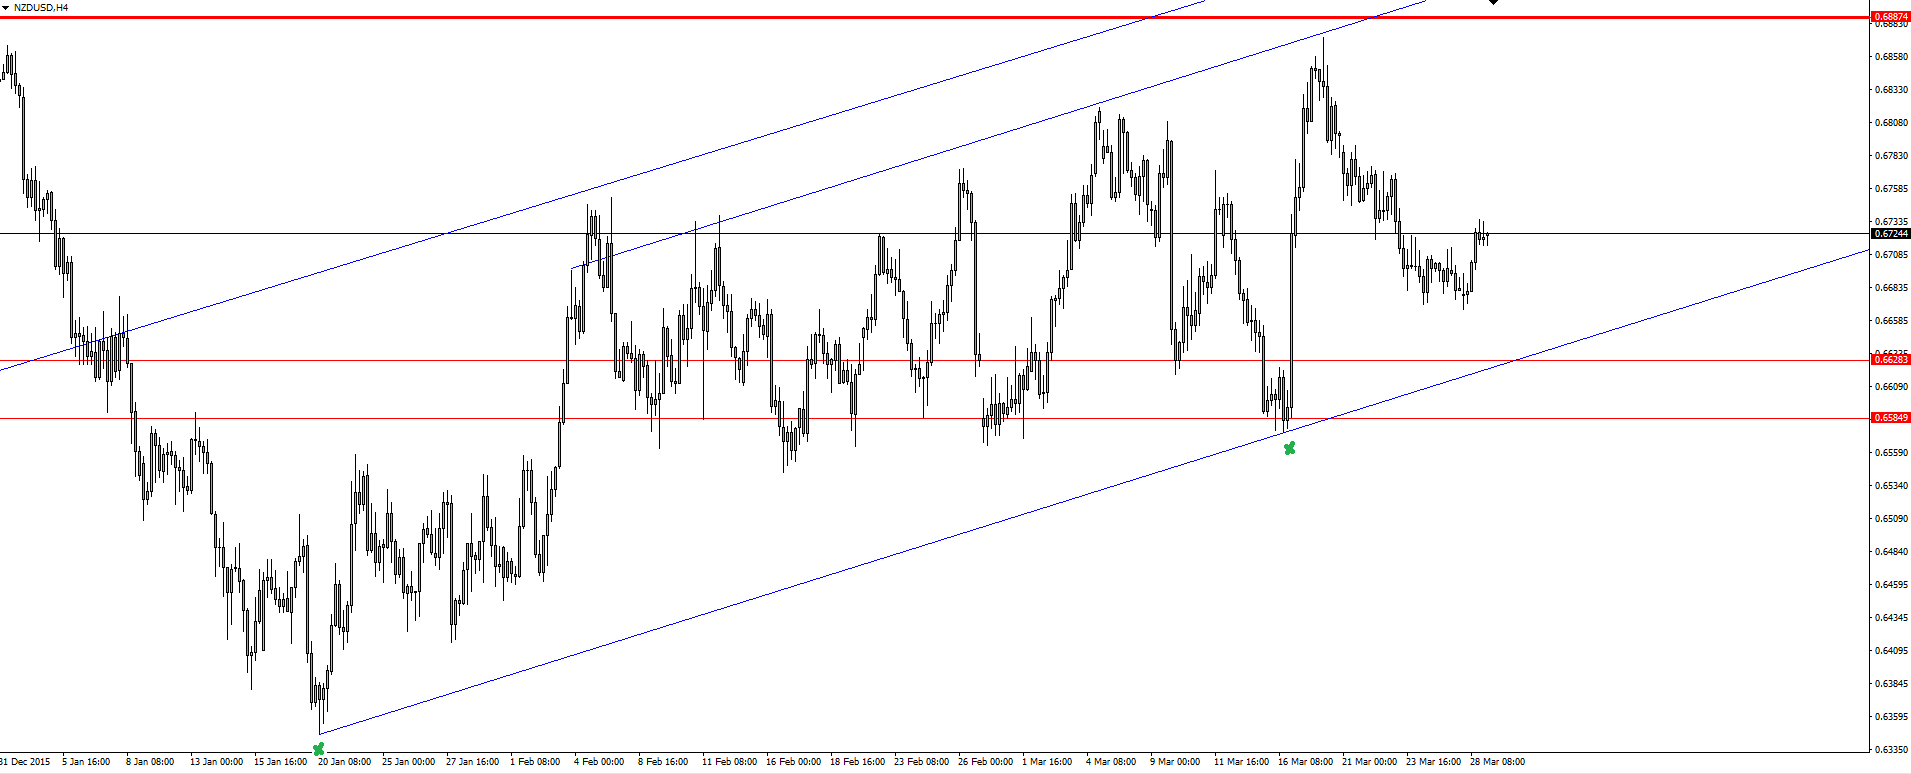
![]() Zooming into the 4 hourly kiwi chart and this lower time frame chart is where you can find the levels to manage your risk around.
Zooming into the 4 hourly kiwi chart and this lower time frame chart is where you can find the levels to manage your risk around.
In the context of the higher time frame chart above, you have two options here. You can take the view that this pause is just short term consolidation in a flag pattern before this lower trend line breaks and price heads lower again. Or you can use this marked trend line support as an early entry to play for a breakout of the weekly range.
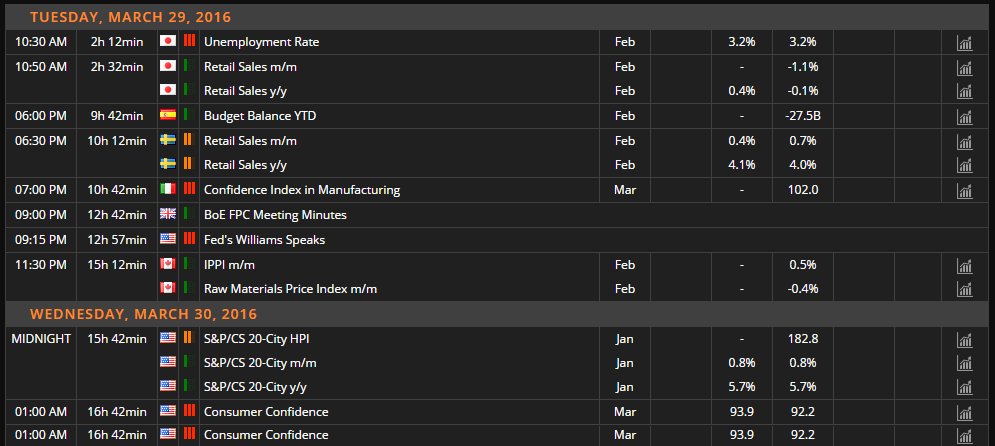
On the Calendar Tuesday:
Risk Disclosure: In addition to the website disclaimer below, the material on this page prepared by Forex broker Vantage FX Pty Ltd does not contain a record of our prices or solicitation to trade. All opinions, news, research, prices or other information is provided as general news and marketing communication – not as investment advice. Consequently any person acting on it does so entirely at their own risk. The experts writers express their personal opinions and will not assume any responsibility whatsoever for the actions of the reader. We always aim for maximum accuracy and timeliness, and Vantage FX on the MT4 platform, shall not be liable for any loss or damage, consequential or otherwise, which may arise from the use or reliance on this service and its content, inaccurate information or typos. No representation is being made that any results discussed within the report will be achieved, and past performance is not indicative of future performance.

