Last week’s stock results were poor for nearly all funds and sectors. Will this continue? Until this coming Wednesday, we can expect a continuing focus on the Fed. After that announcement we may see a change in tone: Pundits will be asking:
Is it finally time for the Santa Claus Rally?
Prior Theme Recap
In my last WTWA (two weeks ago) I predicted that the market stories for the week would emphasize the Fed. The general idea was to examine the avalanche of economic data with special attention to the possible impact on the upcoming Fed decision. This was a pretty lucky guess, since there has been plenty of pre-Fed meeting commentary sprinkled into the discussion of economic data.
My vacation week ended as a market neutral, despite some wild swings. My return on Monday was just in time for a really bad market week featuring Friday’s decline. To get the full story, let us look at Doug Short’s weekly chart. Doug’s full post shows the various relevant moving averages in a very negative week for stocks. (With the ever-increasing effects from foreign markets, you should also add Doug’s World Markets Weekend Update to your reading list).
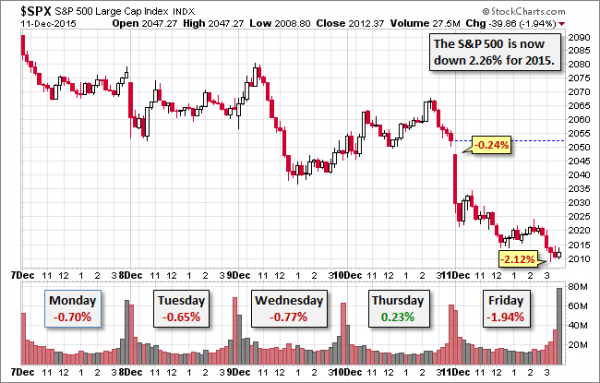
Doug’s update also provides multi-year context. See his full post for more excellent charts and analysis.
The punditry must find an explanation for any market move. Declining oil prices continued as the prime candidate, although others nominated tax-loss selling and the Third Century decision to close redemptions in a bond fund (See “The Ugly” below). Will these effects carry over to next week?
We would all like to know the direction of the market in advance. Good luck with that! Second best is planning what to look for and how to react. That is the purpose of considering possible themes for the week ahead. You can make your own predictions in the comments.
This Week’s Theme
The long-awaited change in Fed policy is scheduled to be announced on Wednesday. While most expect a drawn-out process of “normalizing” rates, it represents an important psychological change. No one really knows what the initial reaction will be. The decision is widely anticipated – so much so that many expect a stock market decline if there is no change. A popular analogy cites Lucy, a football, and a hapless kicker!
What will happen with the Fed decision behind us? Regardless of the first reaction, the next matter for discussion will be the potential for a Santa Claus Rally. People will be asking:
Is it finally time for a Santa Claus Rally?
Expect to hear a range of viewpoints:
- No way! Recent selling proves the start of a bear market.
- Maybe. It depends upon whether oil prices stabilize.
- Maybe. It depends upon the dollar.
- Yes. Seasonal strength and the end of tax loss selling will be the key drivers.
As always, I have an opinion in the conclusion. But first, let us do our regular update of the last week’s news and data. Readers, especially those new to this series, will benefit from reading the background information.
Last Week’s Data
Each week I break down events into good and bad. Often there is “ugly” and on rare occasion something really good. My working definition of “good” has two components:
- The news is market-friendly. Our personal policy preferences are not relevant for this test. And especially – no politics.
- It is better than expectations.
The Good
There was a little good news, but most results were in line with expectations.
- Small business sentiment has flattened according to the Thumbtack survey. Check out the explanations and charts from this relatively new (three-year) survey of 18,000 small business owners.
- Gas prices declined below $2. New Deal Democrat has the round-up. (I filled up last week at $1.83).
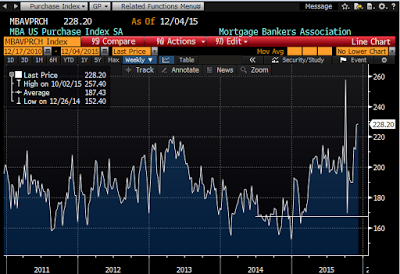
- Mortgage applications are showing strength. These are new loans, not refinancing. Scott Grannis explains why this is an important story for the economy and construction. He notes that both borrowing and lending are (finally) moving higher. (The earlier spike is an artifact of bank reporting requirements).
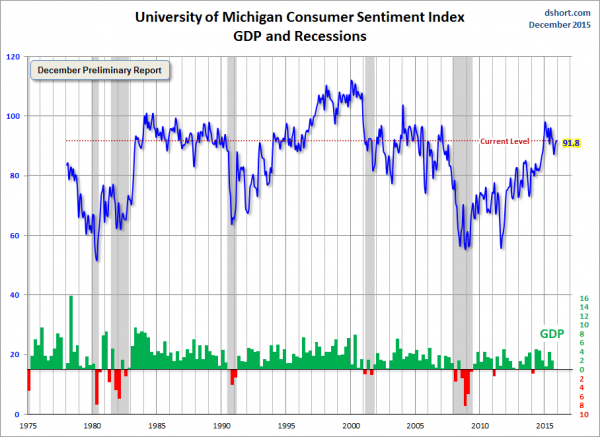
- Michigan sentiment eked out a small gain. This was mostly in line with expectations, but a bit stronger than most economic indicators. Doug Short shows the history of this data series as well as the corresponding economic results.
- Retail sales increased, especially on the “core” items. This was either good or bad, based upon whether you looked at the headline or core numbers. Steven Hansen was not impressed with either, doing his expected deep dive into the data.
The Bad
Some of the economic data was disappointing.
- Initial jobless claims edged higher. Calculated Risk has both charts and analysis.
- High frequency indicators continue to reflect a soft economy, although “less bad.” (Via New Deal Democrat).
- Business inventories were flat. This missed expectations for a gain, and will have a small impact on Q4 GDP. Steven Hansen analyzes the impact on overall sales and explains why this indicator is important.
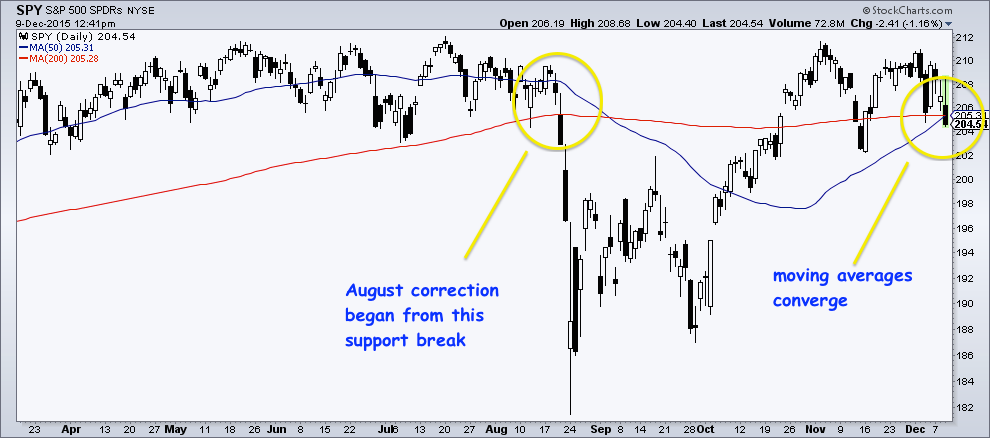
- Technical support has been broken. Josh Brown illustrates with this chart (but see today’s conclusion as well).
The Ugly
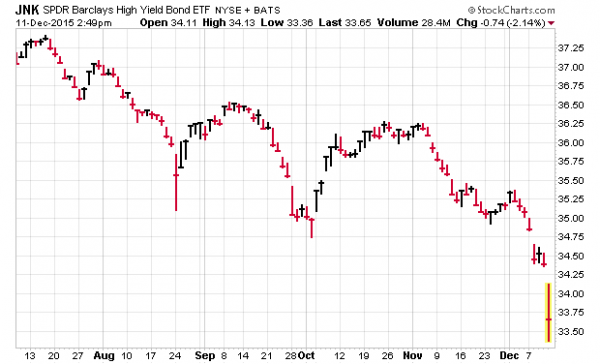
Restrictions on mutual fund redemptions. Fund investors expect the ability to cash in at will. Third Avenue’s Focused Credit Fund has fallen from a recent $2.5 billion in assets to $788 million. The problem, simply put, is that too many holdings are unrated, illiquid bonds. Management feared that continuing redemptions would force distressed sales, harming all but the first of investors who sold. Their plan is to create a liquidating trust and sell assets gradually, perhaps over a period of a year. (DealBook)
While this fund had an extremely high ratio of illiquid holdings, the action reminds many of the liquidity problems for banks holding mortgages in 2008. (MarketWatch). I expect some additional cases, especially among hedge funds. One source noted that a mutual fund “wrapper” is probably not right for this kind of asset. Other high-yield funds declined in response.
Eddy Elfenbein charts the decline in this sector (via SPDR Barclays High Yield Bond (N:JNK)):
The Silver Bullet
I occasionally give the Silver Bullet award to someone who takes up an unpopular or thankless cause, doing the real work to demonstrate the facts. Think of The Lone Ranger. No award this week, but nominations are always welcome.
Quant Corner
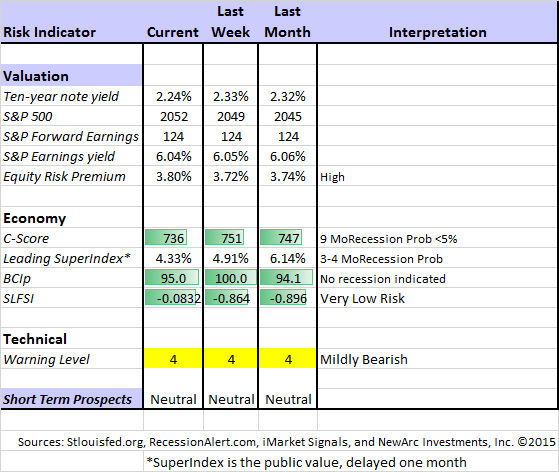
Whether a trader or an investor, you need to understand risk. I monitor many quantitative reports and highlight the best methods in this weekly update. Beginning last week I made some changes in our regular table, separating three different ways of considering risk.
For valuation I report the equity risk premium. This is the difference between what we expect stocks to earn in the next twelve months and the return from the ten-year Treasury note. I have found this approach to be an effective method for measuring market perception of stock risk. This is now easier to monitor because of the excellent work of Brian Gilmartin, whose analysis of the Thomson-Reuters data is our principal source for forward earnings.
Our economic risk indicators have not changed.
In our monitoring of market technical risk, I am using our “new” Oscar model. I put “new” in quotes because Oscar is in the same tradition as Felix and the product of extensive testing. We have found that the overall market indication is more helpful for those investing or trading individual stocks. The score ranges from 1 to 5, with 5 representing a high warning level. The 2-4 range is acceptable for stock trading, with various levels of caution.
Oscar improves trading results by taking some profits during good times and getting out of the market when technical risk is high. This is not market timing as we normally think of it, since it is not an effort to pick tops and bottoms and it does not go short. Instead, Oscar identifies and limits risk. (More to come about Oscar).
I considered continuing to report the Felix updates, but I already have a distinction between long and short-term methods. I want to minimize confusion. Those who want this information can subscribe to our weekly Felix updates.
In my continuing effort to provide an effective investor summary of the most important economic data I have added Georg Vrba’s Business Cycle Index, which we have frequently cited in this space. In contrast to the ECRI “black box” approach, Georg provides a full description of the model and the components.
For more information on each source, check here.
Recent Expert Commentary on Recession Odds and Market Trends
Bob Dieli does a monthly update (subscription required) after the employment report and also a monthly overview analysis. He follows many concurrent indicators to supplement our featured “C Score.”
Georg Vrba: provides an array of interesting systems. Check out his site for the full story. We especially like his unemployment rate recession indicator, confirming that there is no recession signal. He gets a similar result with the twenty-week forward look from the Business Cycle Indicator, updated weekly and now part of our featured indicators.
Doug Short: Provides an array of important economic updates including the best charts around. One of these is monitoring the ECRI’s business cycle analysis, as his associate Jill Mislinski does in this week’s update.
RecessionAlert: A variety of strong quantitative indicators for both economic and market analysis. While we feature the recession analysis, Dwaine also has a number of interesting systems. These include approaches helpful in both economic and market timing. He has been very accurate in helping people to stay on the right side of the market.
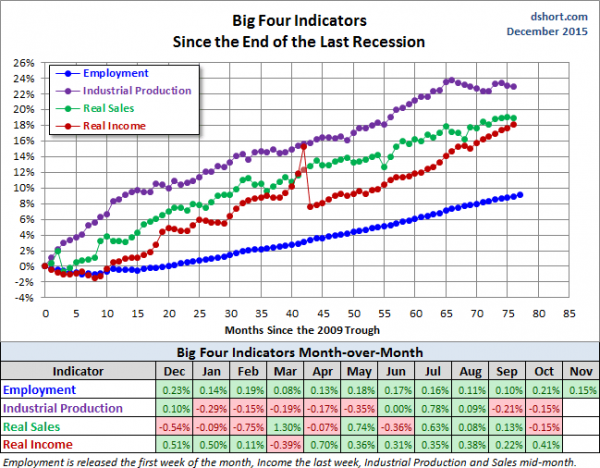
Doug Short’s Big Four update is the single best visual update of the indicators used in official recession dating. You can see each element and the aggregate, along with a table of the data. The full article is loaded with charts and analysis. Here is the latest summary, including the recent employment data.
In response to the increasing number of questionable recession forecasts, Bill McBride writes that he is “not even on watch.”
The Week Ahead
This is a normal week for economic data. While I highlight the most important items, you can get an excellent comprehensive listing at Investing.com. You can filter for country, type of report, and other factors.
The “A List” includes the following:
- FOMC decision (W). Time for a change?
- Building permits and housing starts (T). Important data from an important sector.
- Industrial production (T). Important indicator continues to be weak. Any rebound?
- Leading indicators (Th). Remains popular and has recently been strong.
- Initial claims (Th). Fastest and most accurate update on job losses.
The “B List” includes the following:
- CPI (T). Will eventually be important, but not yet. It will take a few “hot” months to get the Fed’s attention.
- Philly Fed (Th). Gaining visibility as a market-moving indicator – first release featuring the prior month.
- Crude oil inventories (W). Focus on oil prices keeps this report in the spotlight.
There is no FedSpeak until after the decision. Options expiration could add volatility on Friday.
How to Use the Weekly Data Updates
In the WTWA series I try to share what I am thinking as I prepare for the coming week. I write each post as if I were speaking directly to one of my clients. Each client is different, so I have five different programs ranging from very conservative bond ladders to very aggressive trading programs. It is not a “one size fits all” approach.
To get the maximum benefit from my updates you need to have a self-assessment of your objectives. Are you most interested in preserving wealth? Or like most of us, do you still need to create wealth? How much risk is right for your temperament and circumstances?
My weekly insights often suggest a different course of action depending upon your objectives and time frames. They also accurately describe what I am doing in the programs I manage.
Insight for Traders
Oscar continues Felix’s neutral market forecast, but he is fully invested. There are often plenty of good investments, even in an expected flat market. For more information, I have posted a further description — Meet Felix and Oscar. You can sign up for Felix and Oscar’s weekly ratings updates via email to etf at newarc dot com. They appear almost every day at Scutify (follow here).
The S&P 500 has touched 2100 55 times this year! (Ryan Detrick)
Why it is important to develop and maintain great habits. (Brett Steenbarger)
Insight for Investors
I review the themes here each week and refresh when needed. For investors, as we would expect, the key ideas may stay on the list longer than the updates for traders. Major market declines occur after business cycle peaks, sparked by severely declining earnings. Our methods are focused on limiting this risk. Start with our Tips for Individual Investors and follow the links.
We also have a page (just updated!) summarizing many of the current investor fears. If you read something scary, this is a good place to do some fact checking. Pick a topic and give it a try.
Other Advice
Here is our collection of great investor advice for this week.
If I had to pick a single most important article, it would be Wesley Gray’s excellent discussion of investor mutual fund choices. He carefully explains how investors lose money, even when they have chosen funds with excellent performance:
Consider Ken Heebner, who ran the CGM Focus Fund, a diversified mutual fund that gained 18% annually, and was Morningstar Inc.’s highest performer of the decade ending in 2009. The CGM Focus fund, in many respects, resembled the theoretical opportunity outlined above. But the story didn’t end there: The average investor in the fund lost 11% annually over the period.
What happened? The massive divergence in the fund’s performance and what the typical fund investor actually earned can be explained by the “behavioral return gap.”
The behavioral return gap works as follows: During periods of strong fund performance, investors pile in, but when fund performance is at its worst, short-sighted investors redeem in droves. Thus, despite a fund’s sound long-term process, the “dollar-weighted” returns, or returns actually achieved by investors in the fund, lag substantially.
He concludes as follows:
A famous Pogo comic strip declared that, “We have met the enemy and he is us.” This nicely depicts the conundrum facing many investors today. By basing our investment and allocation decisions on recent short-term relative performance, we destroy our ability to reap the benefits of strategies that require a long time horizon to be effective. In the end, active investing is simple, but not easy.
Stock and Fund Ideas
Chuck Jaffe has his annual awards for mutual funds that failed investors by making “dumb mistakes.”
Four reasons to worry about crude oil prices (and related stocks).
Energy stocks with strong upside? Here are ten ideas.
How about a REIT? Chuck Carnevale illustrates how to analyze long-term prospects, using Digital Realty Trust Inc (N:DLR) as an example.
Market Timing
Here is a fun way to test your news-based market timing skill. (Dan Egan) You get to see a headline and then choose whether or not to invest. It is fun to try, and successfully shows why so many individual investors go wrong – actually punished for their focus on news. The examples are not contrived.
Tom Lee, who has been pretty accurate on the markets for several years, always with data-based conclusions, note that one year’s successes, like the popular FANG stocks, usually fail the next year. He has his own list of names that could be next year’s leaders. (We own several of them, and I am considering the others).
Watch out for….
Expensive market insurance. Adam Warner has a great explanation of the cost of puts relative to calls. Most people who are new to options are easily seduced by the attractions of protection. Unless you have skill at market timing, the drag on your portfolio is high.
Alternative investments. Rob Martorana hosts an excellent forum for investment advisors. He is a leading expert on alternative investments. His discussion of the role of cash in hedging risk, and how he came to his conclusions, is both interesting and well-reasoned. While the presentation was aimed at investment advisors, it will be of interest to sophisticated individual investors as well.
Bonds. Here are some ideas for getting your bond portfolio in shape as rate hikes start.
Personal Finance
Professional investors and traders have been making Abnormal Returns a daily stop for ten year. The average investor should make time (even if not able to read every day as I do) for a weekly trip on Wednesday. Tadas always has first-rate links for investors in this special edition. There are several great links, but I especially liked Wade Slome’s post on 10 Ways to Destroy Your Portfolio. They are all great, but I especially like #1:
#1. Watch and React to Sensationalist News Stories: Typically, strategists and pundits do a wonderful job of parroting the consensus du jour. With the advent of the internet, and 24/7 news cycles, it is difficult to not get caught up in the daily vicissitudes. However, the accuracy of the so-called media experts is no better than weather forecasters’ accuracy in predicting the weather three Saturdays from now at 10:23 a.m. Investors would be better served by listening to and learning from successful, seasoned veterans.
I love it when Tadas finds the time to do a full-length article (in addition to his day job as the leading curator for financial stories). This week he wrote about why your home is an asset, not an investment. It is worth reading carefully.
Plenty of investor questions were answered on this live expert conference (which I highlighted on Twitter. Reading through it is time well spent for many investors, especially those with tax or allocation questions.
Final Thoughts
- The Fed. I understand that some recent economic data has been a bit soft. Despite this, I expect the Fed to take the first step in normalizing policy. There may be both an increase in the discount rate and the Fed funds rate range. Expect the statement to emphasize the gradual nature of planned future increases. Economic growth forecasts may be a bit weaker.
- I do not typically forecast the next two weeks of market moves (not in my sweet spot), but this week I’ll play along with what will be the popular question. I expect that getting this first move behind us will be a market positive. Felix and Oscar do not agree, but they work for me.
- The fixation on oil prices continues. This is not a solid economic indicator since it reflects both demand (which has been solid) and supply (which has been excessive). The energy sector continues to lead the entire market, including many stocks that are obviously not related. This disparity represents a big opportunity for long-term value investors.
- Time frames remain important. I want to conclude with another quote from Josh Brown in the “support is broken” post cited above. After identifying some possible reasons for last week’s decline, he writes as follows:
To me, the reason is probably less important than just having the awareness that short-term traders act differently above and below these support levels. Trigger fingers get itchier, liquidity becomes more in-demand and story stocks lose their appeal.
Investors should orient their expectations and mindsets accordingly.
A week ago every pundit was trying to explain the huge Friday rally. This week they are all doing some fast changes to appear smart in the wake of a decline. As Doug Kass likes to note, the market has no memory from day to day. We might still see Santa this year.
If not, market fluctuations should be limited given the low recession probability. The upside will soon reflect improved earnings, solid employment, strong auto sales, and the apparent bottoming in housing. (More to come in my annual preview article).

