The elements are in place for a week of fireworks. Barring some unlikely last-minute news, we are expecting a Greek bank holiday and capital controls on Monday, followed by one of the biggest weeks of the year for economic data, all crammed into a holiday shortened week. Will it be…
Greek ripples or economic fireworks?
Prior Theme Recap
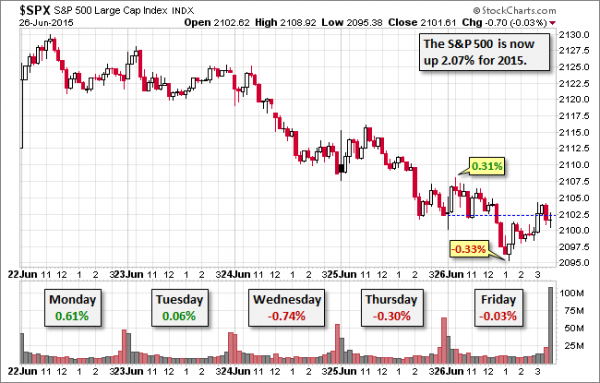
In my last WTWA I predicted that market participants would react to events in Greece, and so it was. There was some other news, but the twists in turns of the Greek negotiations commanded attention and seemed to move markets, at least within a one percent range. As usual, Doug Short’s excellent five-day summary captures the story in one great chart.
Feel free to join in my exercise in thinking about the upcoming theme. We would all like to know the direction of the market in advance. Good luck with that! Second best is planning what to look for and how to react. That is the purpose of considering possible themes for the week ahead.
This Week’s Theme
This week promises fireworks from two very different sources. To start the week, markets will deal with the apparent breakdown of the Greek bailout talks. Then we get a huge week for economic data, with optimism growing due to recent strength. And finally, by 10 AM on Thursday you can expect plenty of players to be heading for the beach and a long weekend.
I expect market observers to be asking:
Should the focus be Greek ripples or a rebounding economy?
The Viewpoints
Barring a last-minute miracle, the optimists on the Greek negotiations were wrong. I summarized the range of viewpoints last week, so check there for more detail on the recap. Briefly put, the question now is whether this is a “Lehman moment” or (as First Trust opined) more like Detroit.
We will get an answer to that by Tuesday, so the rest of the week will focus on the economy.
The familiar viewpoints include the following:
- Some remain worried about deflation, emphasizing Q1 GDP. (IMF)
- The muddle through camp, seeing a continuing threat of recession in a low-growth world. (ECRI)
- Overall strengthening suggesting a 3.5% pace for the remainder of 2015. (Barron’s)
As always, I have my own ideas in today’s conclusion. But first, let us do our regular update of the last week’s news and data. Readers, especially those new to this series, will benefit from reading the background information.
Last Week’s Data
Each week I break down events into good and bad. Often there is “ugly” and on rare occasions something really good. My working definition of “good” has two components:
- The news is market-friendly. Our personal policy preferences are not relevant for this test. And especially – no politics.
- It is better than expectations.
The Good
There was plenty of good economic news.
- Earnings estimates have halted the recent decline and are looking better. (Brian Gilmartin).
- Michigan sentiment rebounded implying strong consumer spending. Doug Short has the complete story, analysis, and some great charts.
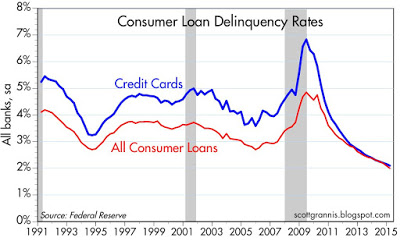
- Consumer spending rose by 0.9%, the biggest gain in six years. And consumers are healthier, with better balance sheets and lower credit card debt. (Scott Grannis)
- New home sales beat expectations.
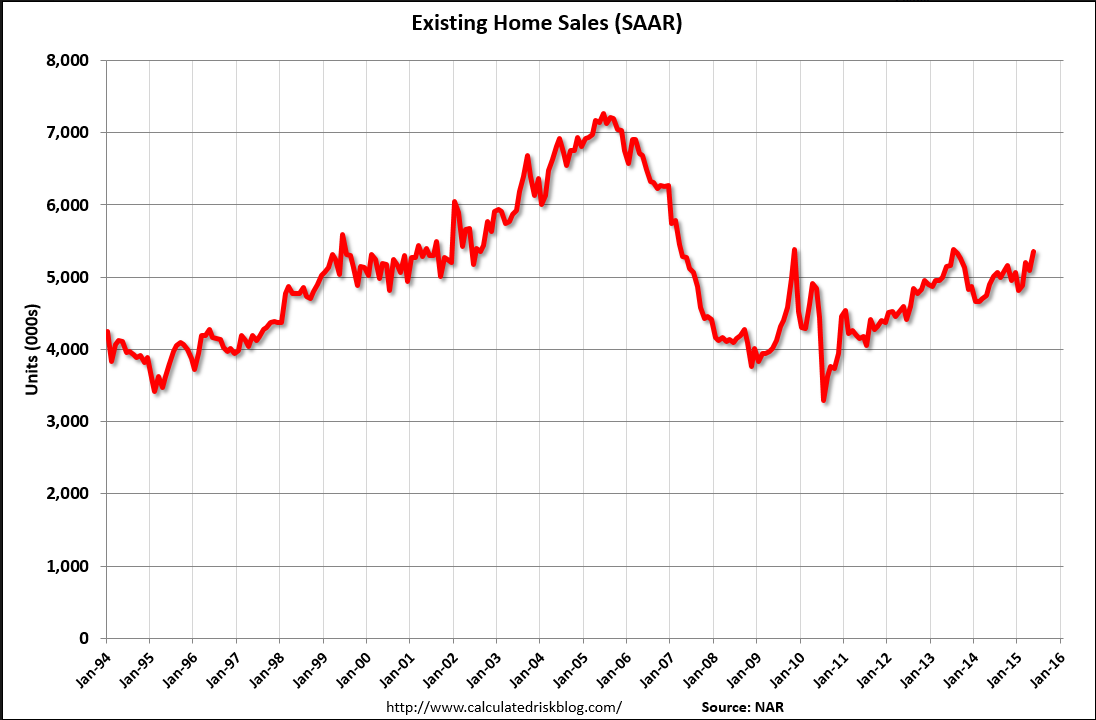
- Existing home sales hit the highest level since 2009. Calculated Risk, as usual, has complete analysis including this chart:
The Bad
There was also some negative data last week, partly on the policy front.
- Durable goods declined by 1.8%, slightly more than expected.
- Rail traffic is still declining. See GEI for analysis of the trends in this noisy series.
- The Greek bailout negotiations unraveled. (Continuing strong coverage at ft.com).
- Americans are not prepared for emergencies. A survey shows that 29% have no emergency savings at all. (Despite the improvement noted above).
The Ugly
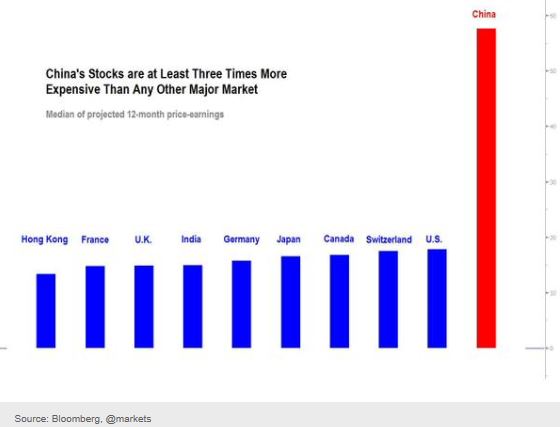
Chinese stocks. Thursday’s trading showed a 7.4% decline in the Shanghai Composite Index, with many stocks hitting the 10% drawdown limit. Some investors are using 6x leverage on portfolios. Full meltdown approaching? (Alpha Architect)
MarketCycle has a nice section on China, including this chart:
The Silver Bullet
I occasionally give the Silver Bullet award to someone who takes up an unpopular or thankless cause, doing the real work to demonstrate the facts. Think of The Lone Ranger. No award this week, but nominations are always welcome.
Noteworthy
Investors often exaggerate unlikely fears. Compare that tendency to the question of which animals kill the most humans – who we should fear most.*
There are plenty of snakes, and gators, and sharks. The astute readers of WTWA might well guess the top threat, but #2 might surprise. (HT MarketCycle, with answer in today’s conclusion).
Quant Corner
Whether a trader or an investor, you need to understand risk. I monitor many quantitative reports and highlight the best methods in this weekly update. For more information on each source, check here.
Recent Expert Commentary on Recession Odds and Market Trends
Bob Dieli does a monthly update (subscription required) after the employment report and also a monthly overview analysis. He follows many concurrent indicators to supplement our featured “C Score.”
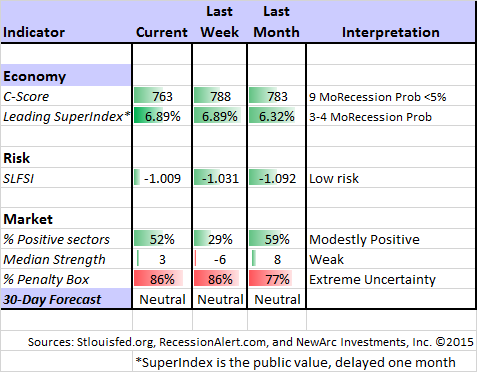
RecessionAlert: A variety of strong quantitative indicators for both economic and market analysis. While we feature the recession analysis, Dwaine also has a number of interesting market indicators. He recently noted an increase in his combined measure of economic stress, although the levels are still not yet worrisome.
Georg Vrba: has developed an array of interesting systems. Check out his site for the full story. We especially like his unemployment rate recession indicator, confirming that there is no recession signal. He gets a similar result from the Business Cycle Indicator (featured below). Georg continues to develop new tools for market analysis and timing, including a combination of models to do gradual shifting to and from the S&P 500.
Doug Short: An update of the regular ECRI analysis with a good history, commentary, detailed analysis and charts. If you are still listening to the ECRI (3½ years after their recession call), you should be reading this carefully. Recently the ECRI finally admitted to the error in their forecast, but still claims the best overall record. This is simply not true. I rejected their approach in real time during 2011 and also highlighted competing methods that were stronger. Until we know what is inside the black box (I suspect excessive reliance on commodity prices and insistence on unrevised data) we will be unable to evaluate their approach. Doug is more sympathetic in his last update. While I disagree, it will require a longer post to elaborate.
In this week’s update Doug notes the ECRI claim of lower growth and more frequent recessions. The two do not necessarily coincide. Recessions do not generally begin with “stalls” but rather with business cycle peaks. Some readers have suggested that I retire this line of discussion from WTWA. I would happily do so if more media sources did a better job with the recession discussion. Until then it provides an important reminder.
The best concurrent economic pulse comes from Doug’s Big Four summary of key indicators, those watched by the NBER’s recession dating committee. There is no evidence of a business cycle peak.
The Week Ahead
This might be the biggest week of the year for economic data.
The “A List” includes the following:
- Employment report (Th). Still the most important for markets, despite the variation and revisions. Continuing strength expected.
- ISM Index (W). Good read on an important sector, with some leading qualities.
- Auto sales (W). Recent strength continuing? Watch the pickup truck sales.
- ADP employment report (W). A very good independent read on private sector employment.
- Initial jobless claims (Th). The best concurrent news on employment trends, with emphasis on job losses.
The “B List” includes the following:
- Pending home sales (M). More good news from housing?
- Chicago PMI (T). The only regional index that really has market significance. Often a hint of the national ISM.
- Construction spending (W). Crucial component if the economic rebound is to continue.
- Crude oil inventories (W). Current interest in energy keeps this on the list of items to watch.
- Factory orders (Th). May data and very volatile, but still of some interest.
There is not much FedSpeak in the holiday-shortened week. Anything fresh about Greece will command attention.
How to Use the Weekly Data Updates
In the WTWA series I try to share what I am thinking as I prepare for the coming week. I write each post as if I were speaking directly to one of my clients. Each client is different, so I have five different programs ranging from very conservative bond ladders to very aggressive trading programs. It is not a “one size fits all” approach.
To get the maximum benefit from my updates you need to have a self-assessment of your objectives. Are you most interested in preserving wealth? Or like most of us, do you still need to create wealth? How much risk is right for your temperament and circumstances?
My weekly insights often suggest a different course of action depending upon your objectives and time frames. They also accurately describe what I am doing in the programs I manage.
Insight for Traders
Felix continued a neutral stance for the three-week market forecast. The confidence in the forecast remains very low with the continuing extremely high percentage of sectors in the penalty box. Despite the overall market verdict Felix has generally been fully invested in three top sectors. For more information, I have posted a further description — Meet Felix and Oscar. You can sign up for Felix’s weekly ratings updates via email to etf at newarc dot com. Felix appears almost every day at Scutify (follow him here).
In response to a recent question from a rookie trader, I recommended the many resources from Charles Kirk, some at nominal cost and some free. Even veteran traders could benefit from a refresher on these topics. I especially like this recent post on how to think like a trader. Hint: Scenarios rather than certainties.
I also mentioned the go-to source for traders trying to improve their performance, Dr. Brett. This week he has a nuanced post on how role modeling can help traders. It is worth a careful read.
Insight for Investors
I review the themes here each week and refresh when needed. For investors, as we would expect, the key ideas may stay on the list longer than the updates for traders. Major market declines occur after business cycle peaks, sparked by severely declining earnings. Our methods are focused on limiting this risk. Start with our Tips for Individual Investors and follow the links.
We also have a page summarizing many of the current investor fears. If you read something scary, this is a good place to do some fact checking. Please also check out part one of my new series on risk. Early reactions were good, and more comments are welcome. At least three more installments are planned.
Other Advice
Here is our collection of great investor advice for this week.
If I had to pick a single most important post, it would be this thoughtful piece by Morgan Housel. Everyone these days seems to know about confirmation bias and the need for contrarian thinking. It is much more difficult to read various sources and consider different viewpoints. Here is a key point:
If you think stocks are like physics, you believe there must be smart people who can measure exactly where the Dow Jones Industrial Average will be in five months, just as smart people can measure exactly when the sun will rise in five months.
So investors complicate things. They trade, they fiddle, they buy this and sell that—all with the hope of achieving a higher return than can be earned sitting still and letting the market work for you.
But the evidence is overwhelming: The odds that you will achieve long-term success by actively trading or timing the market round to zero.
Stock Ideas
Barron’s has an interesting story on a top biotech fund, discussing both methods and some specific names. There is a natural tendency to sell biotech holdings after such a great run. Here is a key thought from the managers:
With biotech stocks up 30% annually in the past five years, it’s fair to ask if they are overvalued, Kolchinsky admits. But, he says, “biotech has generated amazing breakthroughs that no one, five or 10 years ago, would have thought probable. Gene therapy is now starting to work. A whole new field of oncology has emerged. For cancers that were previously thought to be incurable, what appear to be some cures are starting to emerge. There is more to come.”
Value managers at Morningstar mention some favorite names, including surprises like Amazon (NASDAQ:AMZN), where the market “misunderstands” the strategy for future profit.
Brian Gilmartin provides a great lesson in how to use cash flow to compare dividend stocks. Exxon and Chevron: From A Dividend And Free-Cash-Flow Perspective analyzes two popular NYSE stocks XOM and CVX, and provides ideas about the sector, and helps investors to learn a key element of stock picking.
An interactive chart (Capital Market Laboratories) explains why Facebook (NASDAQ:FB) is worth more than Walmart (NYSE:WMT). There are many interesting tables, including data showing $1.34 million in revenue per Facebook employee while “only” $221,000 for Walmart.
Personal Finance
Professional investors and traders have been making Abnormal Returns a daily stop for over ten years. The average investor should make time (even if not able to read every day as I do) for a weekly trip on Wednesday. Tadas always has first-rate links for investors in this special edition. I especially liked this advice about risk and questionnaires. Allan Roth has a strong list of reasons for rejecting the questionnaire approach. I agree with his nuanced approach, which closely reflects my own client interviews. Everyone is different, and a few questions provide very little guidance.
Watch out…
Investors should be careful about buying diamonds. It is more complicated than gold. (Paulo Santos)
Risks in dividend stocks, REITs, and MLPs if interest rates rise. Good analysis from Martin Tillier.
Market Outlook
This week’s Morningstar conference provided excellent interviews with a wide variety of managers. Two of the top “bottoms-up” managers (an approach with which we identify) were pushed hard by interviewers. They wanted some comments on valuation, the Shiller P/E, etc. Here is the key takeaway:
Both managers are bottom-up investors, but when pressed for their market-level view neither see stocks as unreasonably expensive. Nygren says it is important to have the right starting point in thinking about valuations. If you see the market of six or seven years ago as normal, then yes, a triple from that level leaves things looking very pricey. But if you, like Nygren, think 2008, 2009 was a generational buying opportunity, then things don’t look as elevated. Nygren says that P/Es are in line with historical averages. Romick also sees stocks as relatively attractive, given the current interest-rate environment.
Neither seemed to think the Shiller P/E ratio was the right way to look at the market. Nygren says that it is unlikely to see an event as severe as the Great Recession every decade, so pricing one in to valuations is extreme; meanwhile, Romick said the measure doesn’t take the current rate environment into account.
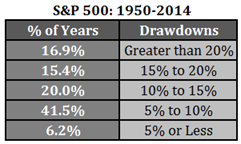
Most years have corrections of 10% or more. You just can’t guess which ones. Ben Carlson provides this table:
Final Thought
I summarized my approach to the Greece situation last week – less optimistic than many:
With that background, here is how I am using the framework to think about this risk. My conclusions are based upon a wide variety of sources. In WTWA I do not make an argument for my own viewpoint, but I usually share it.
I rate the chance of a default as quite high. The Greek leadership, encouraged by its constituency, seems unwilling to make concessions. European leaders seem to have reached their limit. Reports from those close to the negotiations have not been encouraging.
I expect the ultimate consequences to be limited, but only after a period of uncertainty. While contagion is unlikely, markets hate uncertainty.
It is always difficult to know what is reflected in current market prices. My conclusion is based upon nearly thirty years of observation of daily trading. My sense is that the Greece effect has (so far) been pretty minor. Most market participants have been trained to expect an eleventh-hour resolution. (Dr. Brett).
The average investor should not over-react to this, going “all out” of the market for a temporary effect. A trader might try to capture the reaction. We did a little of this in our accounts.
As always, the right trade depends upon your time frame and your agility.
I am much more upbeat on the economic potential, and especially what it might mean for earnings. Beginning with Wednesday’s news, investors might find something to cheer about.
* Puzzle Solution

