We have a reasonable volume of economic data, but few important reports. We are awaiting earnings season. The elephant in the room (sorry – I just couldn’t help myself) is the transition to the Trump Administration. Many are tired of hearing about this and thinking about the consequences, but that is not a sound plan for the intelligent investor. The punditry is far from exhausting this topic. They are making their own transition from Candidate Trump to President Trump. In the coming week, the punditry will be asking:
What can investors really expect under Trump?
Last Week
Last week the economic news was strong, but with little reaction from stocks.
Theme Recap
In my last WTWA I predicted a focus on more reaction to PEOTUS versus the regular Santa Claus rally. Despite all the economic data, that was in fact a popular topic. Go figure.
The Story in One Chart
I always start my personal review of the week by looking at this great chart of the S&P 500 from Doug Short. He captures the story for the week and the continuing narrow range.
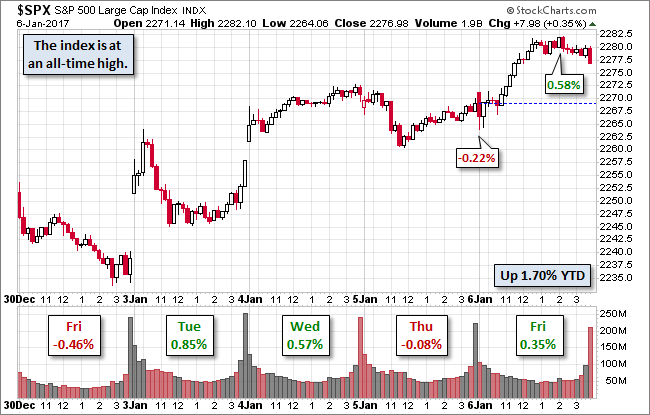
Doug has a special knack for pulling together all the relevant information. His charts save more than a thousand words! Read his entire post where he adds analysis grounded in data and several more charts providing long-term perspective.
The News
Each week I break down events into good and bad. Often there is an “ugly” and on rare occasion something very positive. My working definition of “good” has two components. The news must be market friendly and better than expectations. I avoid using my personal preferences in evaluating news – and you should, too!
This week’s news was quite good-almost all positive. I make objective calls, which means not stretching to achieve a false balance. If I missed something for the “bad” list, please feel free to suggest it in the comments.
The Good
- Chemical activity ends the year strongly. Get the full story and a helpful table of the relevant data at GEI.
- Construction spending was up 0.9%, to the highest level in ten years. (Washington Post). According to our go-to source, Calculated Risk, it was another solid report.
- Earnings pre-announcements were more positive than usual in Q416. (FactSet).
- Home loan originations are stronger than they were one year ago. (CoreLogic via GEI).
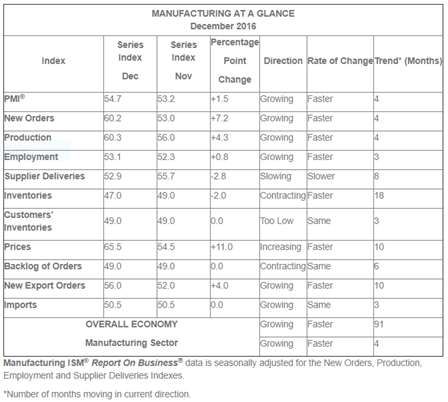
- ISM manufacturing reached 54.7, the highest level in two years. The ISM also has a strong interpretation of the data, headlining their press release with some leading indicators and including a supporting table.
New Orders, Production and Employment Growing
Inventories Contracting
Supplier Deliveries Slowing
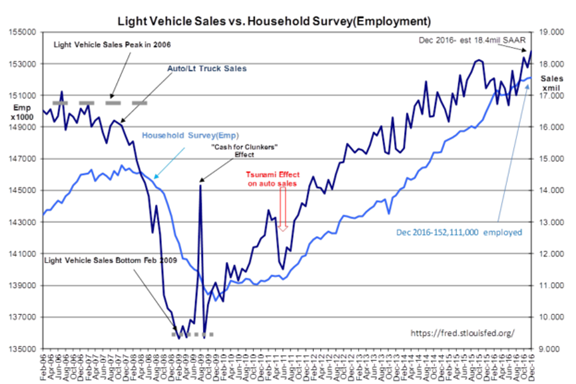
- Auto Sales were strong, reflecting the overall economy. “Davidson” (via Todd Sullivan) discusses the data, some of the credit relationships, and this interesting relationship with employment.
- {{ecl-227||Employment data}} showed continuing strength. Some call the Friday data “weak.” Those were the headlines in the morning, right after the market opened. When stocks closed higher, the headlines changed —- referring to the same data. I had to put the mute on as the punditry tried to draw inferences from a 20K miss when there is 120K sampling error – plus revisions. There were both good points and weak points in last week’s data.
- Good
- Employment growth remains consistent with moderate economic growth
- Unemployment remains very low
- Wages have started to increase, something that critics have called necessary for the last few years.
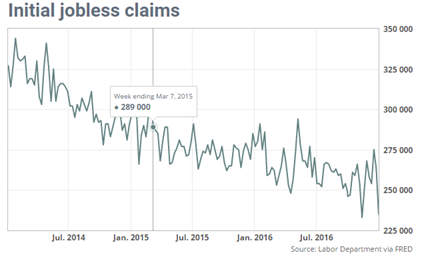
- Initial jobless claims tumbled again, close to a 43-year low (Jeff Bartash, MarketWatch)
- Good
- Weak
- ADP private payroll growth, which I view as important, declined 60K from the prior month and missed expectations by 20K.
- The headline payroll gain was also a 20K miss from expectations.
The WSJ has a nice chart pack that is republished in several places. Take a look here.
The Bad
- Factory orders declined 2.4% on a monthly basis, but it was mostly noise from transportation changes.
- Mortgage applications turn negative. New Deal Democrat’s valuable high frequency indicators highlight this news, but you should read the entire post.
The Ugly
Bitcoin. Not that long ago the debate was whether this would work as a substitute currency. Last week it dropped 20% in a single day. Yes, that followed a 40% increase in the prior two weeks. It is still more like leveraged commodities trading than a currency. (Investing.com).
The Silver Bullet
I occasionally give the Silver Bullet award to someone who takes up an unpopular or thankless cause, doing the real work to demonstrate the facts. This week’s award goes to KraneShares for an excellent post taking on several popular misconceptions about China – ghost cities, currency manipulation, and the significance of manufacturing weakness. I find their KWEB product a good way to invest in China despite limited knowledge about individual stocks – or confidence in reports and accounting. The conclusions are not just opinions of the fund managers. Here is one example:
Stephen Roach, former Morgan Stanley Chief Economist and Senior Fellow at Yale University’s Jackson Institute for Global Affairs, once said that China’s modernization is “the greatest urbanization story the world has ever seen” and that ghost cities will soon become “thriving metropolitan areas1.” Regardless of what Mr. Roach, and many other China scholars, have said the notion of widespread Ghost Cities in China has persisted with many US investors.
The Week Ahead
We would all like to know the direction of the market in advance. Good luck with that! Second best is planning what to look for and how to react. That is the purpose of considering possible themes for the week ahead. You can make your own predictions in the comments.
The Calendar
It is back to normal for the volume of economic data, but fewer of the most important reports.
The “A” List
- Retail sales (F). There is great interest in the December results, particularly after weak reports from some big players.
- Michigan sentiment (F). Continuing strength in January?
- Initial claims (Th). The best concurrent indicator for employment trends.
The “B” List
- JOLTS report (T). Important as a read on the structure of the labor market, not some macro indicator as usually cited.
- PPI (F) . Interest in the inflation reports is building, but the worrisome stages are not imminent.
- Consumer credit (M). The big increase expected in November will get plenty of spin.
- Business inventories (F). Volatile November data, but relevant for the Q4 GDP calculation. Another spin candidate.
- Wholesale inventories (T) . See Business Inventories (above).
- Crude inventories (W). Recently showing even more impact on oil prices. Rightly or wrongly, that spills over to stocks.
Fed speakers are out in force this week, including Chair Yellen. Enjoy!
Next Week’s Theme
Like it or not, the market focus on Trump is continuing. It is not my job to pick what I want others to think about. The purpose of WTWA is to help us all prepare, whether we like the current topics or not. Without much fresh data, expect another round of punditry about Trump. It might get a little stronger, with more people engaged in:
Digging Down on the Trump Effect
The initial discussion on the post-election effect is already outdated. Dr. Ed Yardeni explains that the reaction was not very surprising.
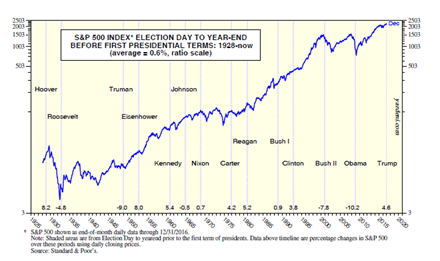
Whether this continues is another question. Hoover and Carter are among the best starts while Obama was among the worst. Where you wind up has a lot to do with where you start.
Some investors may already be tired of the Trump theme, but it will remain the most popular topic in the weeks ahead. The punditry has gone through two stages. First, the immediate knee-jerk reaction to the election. Second, a period of wondering, “Is that all there is?” The stage is now set for a more careful look at the implications of the Trump Administration.
Unlike transitions of the past, this President-elect is already taking an active role. Each week we learn a little more both through statements (often via tweets) and from cabinet appointments. Serious investment analysts (including me) are going through a careful, three-step process:
- How will President Trump differ from Candidate Trump? There are some normal patterns, but those have not worked well in this case!
- How quickly can policies be changed?
- Immediate actions, under the President’s direct control;
- Steps requiring cooperation from a friendly Congress;
- Policies where Congressional cooperation is required, but his party is not unified;
- Policies that are exceptionally complicated, requiring more time and planning; and
- Changes where building the necessary support is unlikely.
- What are the investment implications for the most likely policies?
There is no reward for jumping the gun in this analysis, especially with a daily infusion of more relevant data.
What does this mean for investors? As usual, I’ll have a few ideas of my own in today’s “Final Thoughts”.
Quant Corner
We follow some regular great sources and the best insights from each week.
Risk Analysis
Whether you are a trader or an investor, you need to understand risk. Think first about your risk. Only then should you consider possible rewards. I monitor many quantitative reports and highlight the best methods in this weekly update.
The Indicator Snapshot
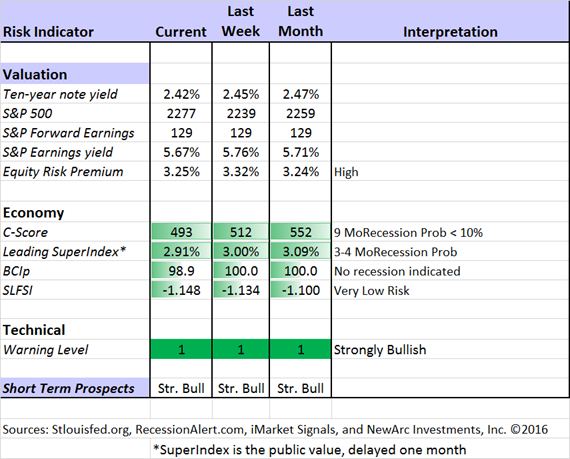
Although dropping last week, the yield on the ten-year note has increased significantly since the election. This has lowered the risk premium a bit. I suspect much more to come. By this I mean that the relative attractiveness of stocks and bonds will continue to narrow.
The C-Score has also dropped, but is still well out of recession warning territory.
The Featured Sources:
Bob Dieli: The “C Score” which is a weekly estimate of his Enhanced Aggregate Spread (the most accurate real-time recession forecasting method over the last few decades). His subscribers get Monthly reports including both an economic overview of the economy and employment.
Holmes: Our cautious and clever watchdog, who sniffs out opportunity like a great detective, but emphasizes guarding assets.
Brian Gilmartin: Analysis of expected earnings for the overall market as well as coverage of many individual companies.
RecessionAlert: Many strong quantitative indicators for both economic and market analysis. While we feature his recession analysis, Dwaine also has several interesting approaches to asset allocation. Try out his new public Twitter Feed. His most recent research update suggests some “mixed signals” from labor markets.
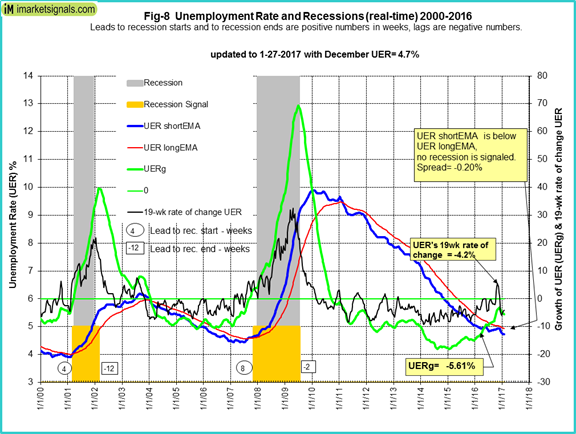
Georg Vrba: The Business Cycle Indicator and much more.Check out his site for an array of interesting methods. Georg regularly analyzes Bob Dieli’s enhanced aggregate spread, considering when it might first give a recession signal. Georg thinks it is still a year away. It is interesting to watch this approach along with our weekly monitoring of the C-Score. Georg has updated his unemployment-based recession indicator with the same conclusion.
Doug Short: The World Markets Weekend Update (and much more). Jill Mislinski updates the ECRI coverage, noting that their public leading index has reached an all-time high. Surprisingly, the ECRI public statements remain bearish on the U.S. economy, the global economy, and stocks. It is as if they never recovered from their mistaken recession call in 2011. They have been out of step ever since.
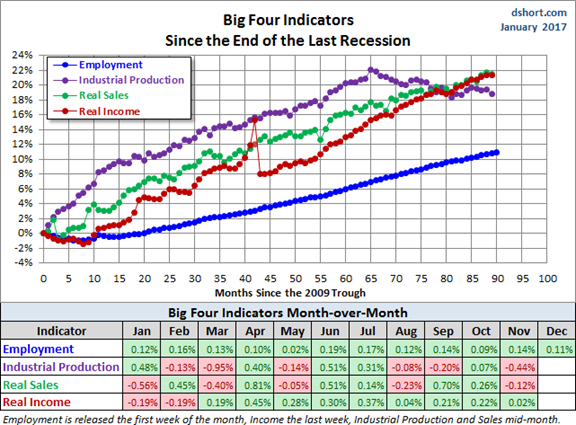
Doug also provides regular updates for the most important economic indicators used in defining business cycle peaks (AKA the start of a recession). A recession requires both a peak and a significant decline in the important indicators. The first chart shows how that happened in the last recession as well as the action after the most recent peak in November, 2014.
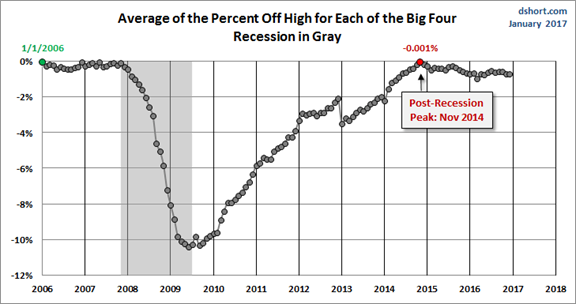
This is the chart showing each of the Big Four indicators.
How to Use WTWA (especially important for new readers)
In this series, I share my preparation for the coming week. I write each post as if I were speaking directly to one of my clients. Most readers can just “listen in.” If you are unhappy with your current investment approach, we will be happy to talk with you. I start with a specific assessment of your personal situation. There is no rush. Each client is different, so I have eight different programs ranging from very conservative bond ladders to very aggressive trading programs. A key question:
Are you preserving wealth, or like most of us, do you need to create more wealth?
Most of my readers are not clients. While I write as if I were speaking personally to one of them, my objective is to help everyone. I provide several free resources. Just write to info at newarc dot com for our current report package. We never share your email address with others, and send only what you seek. (Like you, we hate spam!) Free reports include my latest paper, The Top Twelve Investor Pitfalls – and How to Avoid Them. If you regularly navigate these problems, you can fly solo! While that is true for most of my very sophisticated audience, some might benefit from our help.
Best Advice for the Week Ahead
The right move often depends on your time horizon. Are you a trader or an investor?
Insight for Traders
We consider both our models and the top sources we follow.
Felix and Holmes
We continue with a strongly bullish market forecast. Felix is fully invested. Oscar is fully invested in aggressive sectors. The more cautious Holmes also remains fully invested, but with continued profit-taking and position switching. The group meets weekly for a discussion they call the “Stock Exchange.” In each post I include a trading theme, ideas from each of our four technical experts, and some rebuttal from a fundamental analyst (usually me). There are fresh ideas each week. You can also ask questions and have a little fun.
Top Trading Advice
Howard Lindzon covers the key topic of information overload, and what to do about it. He offers some concrete guidelines on how to cut down the size of your stock screens and the number of people you follow. Great ideas.
Adam H. Grimes has a useful and timely post for traders turning the page on the calendar. While the focus is on motivation, he has several specific suggestions.
Dr. Brett Steenbarger continues to be the MVP for traders who want to improve. He combines his knowledge of psychology, his experience in training traders, with a broad knowledge of markets and key indicators. The combination provides regular insights for traders. One of his helpful posts from last week was some help on “how to break our worst trading habits“. I have been very concerned about this topic recently. Many traders seem uninterested in improving.
Brett’s most powerful post helps to explain why. Most short-term traders need some big moves. Big moves are usually declines. When the market is not delivering, it leads to frustration, bias, and reaching for explanations.
This bearish bias can be deadly, as it leads traders to ignore the actual flow of supply and demand and color their market perceptions with their preferences. More than once, I’ve heard traders complain that a move higher was “fake” or “manipulated” or caused by “machines”, thus discounting what the market was doing and instead sticking with a bias.
He goes on to explain why this attitude is unrealistic in the face of big market forces
I look at many sources for good trading ideas, but I welcome suggestions from readers to broaden the list of candidates.
Insight for Investors
Investors have a longer time horizon. The best moves frequently involve taking advantage of trading volatility!
Best of the Week
If I had to pick a single most important source for investors to read this week it would be … maybe none of the above.
Throughout the year, I highlight the best efforts from various sources. Each week I find some outstanding advice. This week I sense that Brett Steenbarger’s analysis of trading bias also applies to investors. People are bombarded with claims that help to justify their decisions if they have been on the wrong side of the market.
Scientific American describes the difficulty in trying to convince people “when facts fail.” Some of the examples are from the failed end of the world predictions. Ben Carlson reviews the success of Harry Dent, whose doomsday predictions remain popular no matter how costly to investors.
Trying to help people find a way out of this trap – and more success – I crafted some investor New Year’s resolutions that you would not see anywhere else. Unless I have lost my mind, it is loaded with good advice. Yet it was not a highly-recommended post. Perhaps that supports the basic point about bias, but I still hope a few people were helped.
Stock Ideas
Buy CRAP? That is the creative acronym from Tom Lee. He has been accurately bullish for years, but now sees little upside in the overall market. In his mind, it is time to focus on Computers, Resources, American banks and Phone carriers – all levered to investment recovery, inflation and deregulation.
Tiernan Ray suggests considering FANG. This helpful article includes several other tech ideas.
How about biotech? Bret Jensen considers the possibility for a rebound.
Great analysis in a humorous presentation? Abba’s Aces has a playoff bracket consisting of stocks. Each win represents a nice analysis of two companies. The factors represent a process like ours, and the results make sense. Here is the current bracket:

Our trading model, Holmes, has joined our other models in a weekly market discussion. Each one has a different “personality” and I get to be the human doing fundamental analysis. We have an enjoyable discussion every week, including four or five specific ideas that we are buying. This week Holmes (who has been very hot) likes Mallinckrodt (NYSE:MNK). Check out the post for my own reaction, and more information about the trading models.
Seeking yield? Blue Harbinger highlights a closed end fund trading at a discount. It has a yield of 4.1%, but should be regarded as contrarian. The question with CEF’s at a discount is whether the discount is deserved. In this case, it is mostly about the interest rates. Read the full post and give it some thought before you go on your own personal REIT expeditions.
Personal Finance
Professional investors and traders have been making Abnormal Returns a daily stop for over ten years. If you are a serious investor managing your own account, this is a must-read. Even the more casual long-term investor should make time for a weekly trip on Wednesday. Tadas always has first-rate links for investors in his weekly special edition. There are always several great choices worth reading. My personal favorite this week is the simple advice from Allan S. Roth in the WSJ – risk, rebalancing, tuning out noise, and watching fees.
Seeking Alpha Editor Gil Weinreich’s Financial Advisors’ Daily Digest has quickly become a must-read for financial professionals. Somewhat to my surprise, the topics also stimulate comments from active individual investors. It has added to the value of the posts for both groups. This week, although I disagree with the basic conclusion, I recommend that you read the discussion of debt in this post. My own view is that individual investors should carefully assess debt versus their assets. The preoccupation with societal debt and market effects is overdone – a subject for another day.
Watch out for…
Questionable investment practices. In contrast with the famous Ronald Reagan line, the government actually is there to help you “…make better informed investment decisions and avoid common scams in 2017.” GEI reports on ten tips from the SEC. #5 is especially sad, but very common:
Be alert to affinity fraud. Affinity frauds target members of identifiable groups, such as the elderly, religious or ethnic communities, or the military. Even if you know the person making the investment offer, be sure to check out the investment and the person’s background – no matter how trustworthy the person seems.
Final Thoughts
My analysis of Trump Effects remains a work in progress. I can give you a few hints about the conclusions.
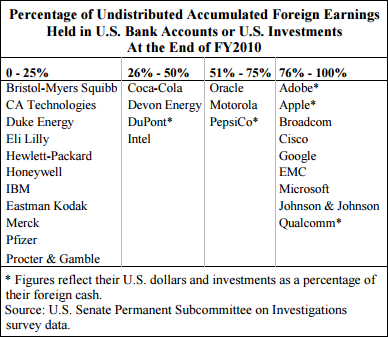
- Some sort of fund repatriation will be part of the package. All else equal, that suggests a bias to companies that might gain the most. The Atlanta Fed provides some hard data.
- Expect tax cuts, probably including some nods to Democrats. This will represent fiscal stimulus.
- Cyclicals continue to show strength, partly from the expectation noted above. (Eddy Elfenbein).
- The trade war is likely to be a bargaining approach. It is an error to over-react on speculation.
- The health care issue is far from settled. Early symbolic repeal? Yes. Real changes? Unclear.
- And that is just a start.
There is a much more to this story. It requires both skill and careful research. As a former poli-sci and public policy professor, a long-time expert in economics, and a thirty-year veteran of financial markets, I have a good package of skills for this problem. That is good news, but it also means that I understand the challenge and the complexity.
Most traders and investors are responding from the gut. They may have valid concerns, but they are getting them mixed up with the need for calm, unemotional decisions. In my annual preview at Seeking Alpha I warned about over-reacting to emotion. (I always appreciate participating in this annual series, which generates many ideas you do not see elsewhere).
In the crucial weeks ahead, a mistake could be costly. Study hard and move carefully.
