The economic calendar includes few reports, crammed into two days of a holiday-shortened week. Many will be taking time off – including some of the “A List” pundits. I expect to see some new faces on financial television and a lot of discussion about consumers and the economy. Many will be asking:
What does Black Friday mean for the economy, and for stocks?
Last Week Recap
In the last edition of WTWA I suggested that housing would be the most important story, and that some would focus on millennials as a potential market driver. I may have been accurate on the biggest story, but not on the media attention. Allegations of sexual misconduct seem to command popular interest and improve readership and ratings. Even the story about elephants pushed housing news aside.
The ability to influence the current agenda is extremely important, but it deserves more analysis than I can provide here. A future topic on my ever-growing agenda.
The Story in One Chart
I always start my personal review of the week by looking at this great chart of the S&P 500 from Doug Short via Jill Mislinski. She notes the loss of 0.13% on the week. Once again, it was a week of very low volatility; the intra-week range was only about 1.5%. Eddy Elfenbein takes note, and provides a great perspective on the current market. A small decline stands out after 54 consecutive days where the market closed within 1% of the all-time high.
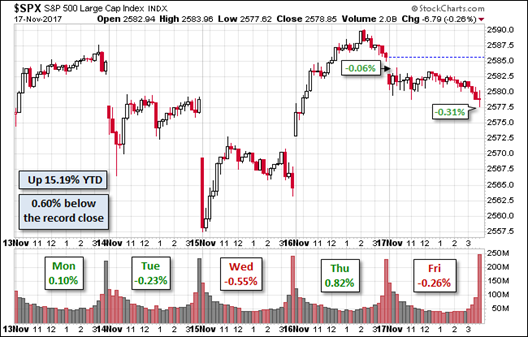
Doug has a special knack for pulling together all the relevant information. His charts save more than a thousand words! Read the entire post for several more charts providing long-term perspective, including the size and frequency of drawdowns.
Personal Note
I will be working part of next week but expect to miss the next two installments of WTWA. I’ll try to post some of the indicator information.
I have much to be thankful for, as does my family. I hope my readers enjoy some great time with family and friends in the week ahead.
The News
Each week I break down events into good and bad. For our purposes, “good” has two components. The news must be market friendly and better than expectations. I avoid using my personal preferences in evaluating news – and you should, too!
The economic news has been mostly positive, despite the uptick market volatility and the slight decline.
The Good
- Housing data were strong. Housing starts rose 13.7% handily beating expectations. Building permits hit an annual rate of almost 1.3 million, also beating expectations. As always, we read carefully the comments of housing expert Calculated Risk.
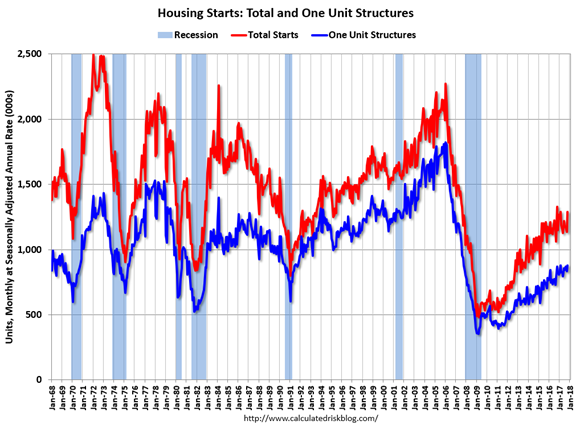
New Deal Democrat, something of a skeptic on the housing story, calls it an “excellent report.” He notes that the effect of last year’s mortgage interest increase is being offset by demographic forces. (That has a familiar ring to it).
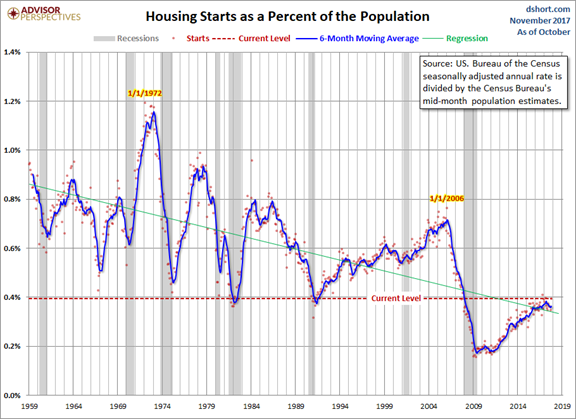
Jill Mislinski offers another perspective, a population-adjusted view. By this measure, starts remain much lower than the historical highs, part of a declining long-term trend.
- Earnings estimates are moving higher. (Brian Gilmartin).
- Architecture billings, a leading indicator for construction, bounced back in October. (Calculated Risk).
- Retail sales rose only 0.2%, but that beat expectations. The prior month gain was also revised higher from 1.0% to 1.2%.
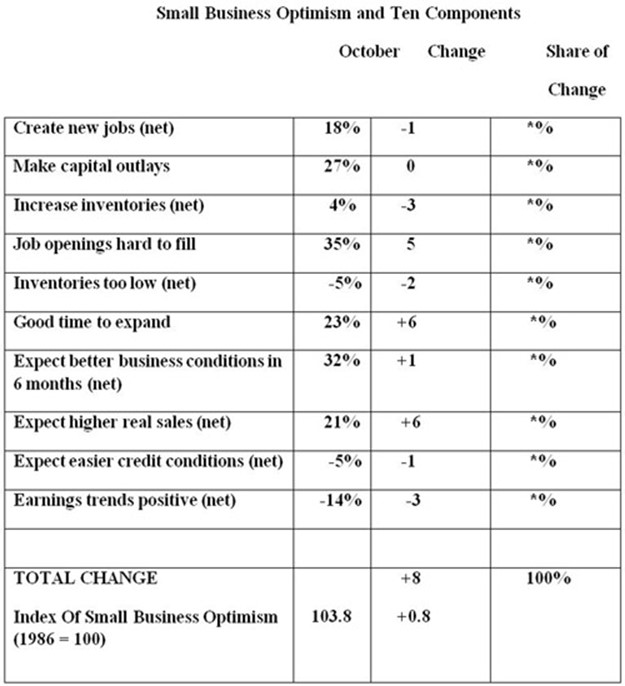
- NFIB small business optimism moved even higher, from 103 to 103.8. John Mauldin, reaching once again into his wide network of friends, provides us with a detailed look at this index, including changes in the key components. The difficulty in filling job openings is currently the top problem for small businesses.
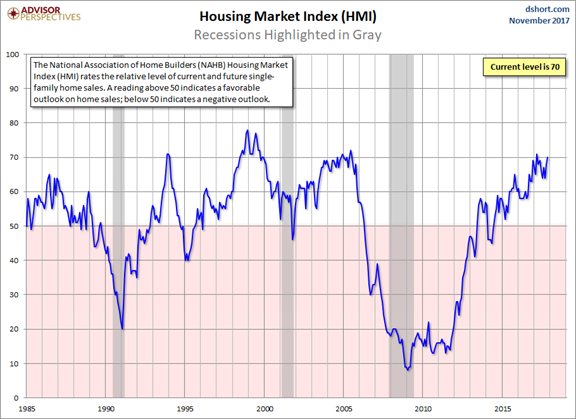
Home Builder confidence hit an eight-month high and beat expectations. (Jill Mislinski)
The Bad
- Jobless claims once again moved higher from 239K to 249K, not only worse but missing expectations of a smaller increase.
- Business borrowing demand is not responding to easier bank lending standards. (New Deal Democrat)
- Rail traffic growth is slowing with levels now equal to a year ago. (Steven Hansen, GEI)
The Ugly
The Bitcoin slide. Values dropped below $7000 on Wednesday, a decline of more than $1000 on the day. This illustrates my recent post on the Stock Exchange where I suggested Bitcoin as a trading vehicle, not an investment.
We will soon have Bitcoin futures available for trading at the Merc. Futures contracts allow substantial leverage on the underlying. Is that really needed here? Brian Gilmartin looks at the possible motives and the effect on CME. It is a good read. This product will be used both for hedging and for speculation. This could have a dramatic effect on the prior trading patterns. Stay tuned.
The rumored North Korean nuclear sub (Newsweek) is the ugly runner-up this week.
The Week Ahead
We would all like to know the direction of the market in advance. Good luck with that! Second best is planning what to look for and how to react.
The Calendar
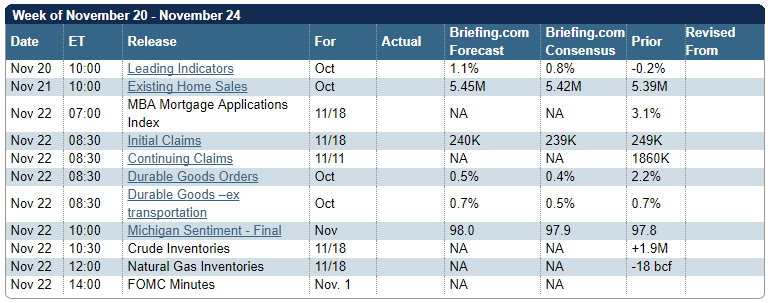
We have a rather light calendar, but crammed into a short week. Many market participants will be missing in action after Wednesday’s opening and skipping the partial session on Friday. Even Fed speakers are taking the week off. The financial media will also be featuring some new faces. There is some interest in Leading Indicators and Michigan sentiment, but few will be around to “explain” the FOMC minutes on Wednesday afternoon.
Briefing.com has a good U.S. economic calendar for the week (and many other good features which I monitor each day). Here are the main U.S. releases.
Next Week’s Theme
In this holiday shortened-week, I am expecting attention to the obvious, the annual holiday gift-buying season. Competition from the tax bill will be slight, since it will not be taken up in the week ahead. (More on that in my Final Thought).
While there will not be final data on shopping, that will not stop the punditry. Pictures from malls will accompany survey data and the “early returns” on what people are spending. We (and the financial media) are interested in the shopping effects – both the economy and individual stocks. Financial reporters will be asking:
Will Black Friday lead to green on your screen?
The topic does not lend itself to my customary bearish to bullish range. Instead, I’ll just cite some very interesting data on this subject. Skeptics will question any of the forecasts for the season and the surveys of consumers at malls. Those results have indeed been erratic. We will not really know the answers to the seasonal shopping effects until we get some actual hard data from sales reports.
- Combined Black Friday and Thanksgiving spending – just online – is expected to be $5.57 billion, an increase of $300 million over last year. The top three online stores will include Amazon (NASDAQ:AMZN), Walmart (NYSE:WMT), and (probably) Target (NYSE:TGT).
- Deloitte predicts that e-commerce will top in-store spending. This is based upon a survey of plans about how to shop, what platform to use for mobile, and methods of payment.
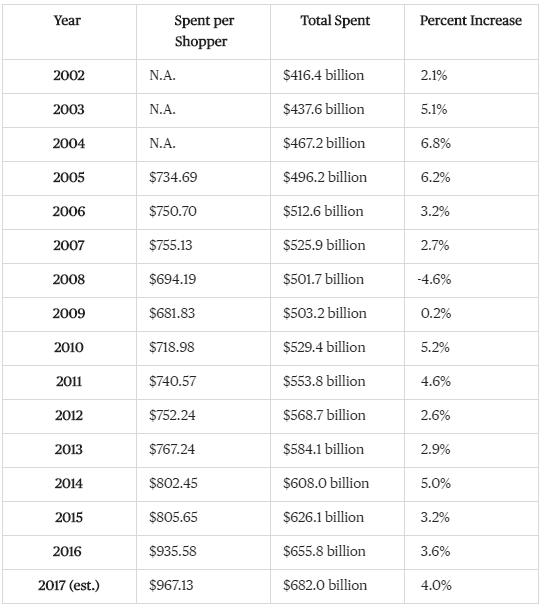
- Here are data for past years and the National Retail Federation (often a little optimistic) for this year.
- Many consumers exceed their budgets and pile up credit card debts that take three months to pay off. The Motley Fool offers some other dark facts about Black Friday.
As usual, I’ll have more in the Final Thought, where I always emphasize my own conclusions.
Quant Corner
We follow some regular featured sources and the best other quant news from the week.
Risk Analysis
I have a rule for my investment clients. Think first about your risk. Only then should you consider possible rewards. I monitor many quantitative reports and highlight the best methods in this weekly update.
The Indicator Snapshot
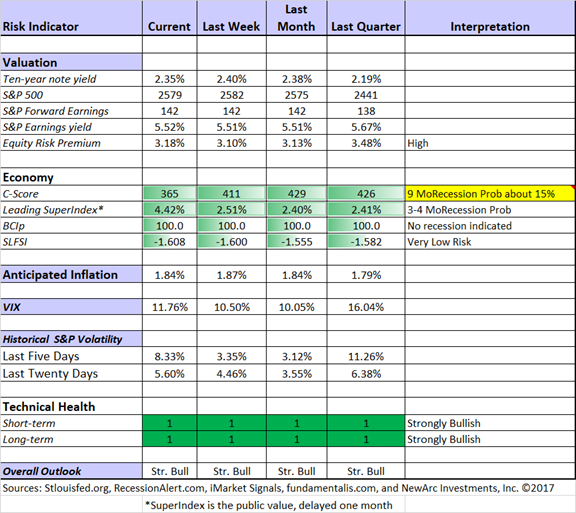
The C-Score dropped quite a bit. While we are still not in a danger range in this curvilinear relationship, the implied nine-month recession odds are now a firmer 15%, as noted in the chart.
The Featured Sources:
Bob Dieli: Business cycle analysis via the “C Score.
RecessionAlert: Strong quantitative indicators for both economic and market analysis.
Brian Gilmartin: All things earnings, for the overall market as well as many individual companies.
Georg Vrba: Business cycle indicator and market timing tools.
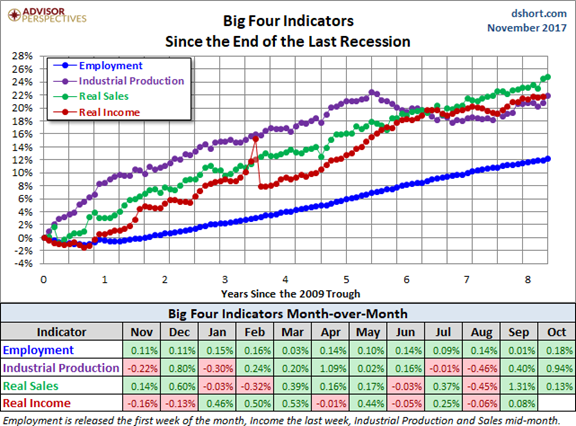
Doug Short: Regular updating of an array of indicators. Great charts and analysis. Let’s take another look at the regular update (via Jill Mislinski) of the Big Four indicators most influential in recession dating. The recent strength in these indicators is clear from the chart.
Guest Source:
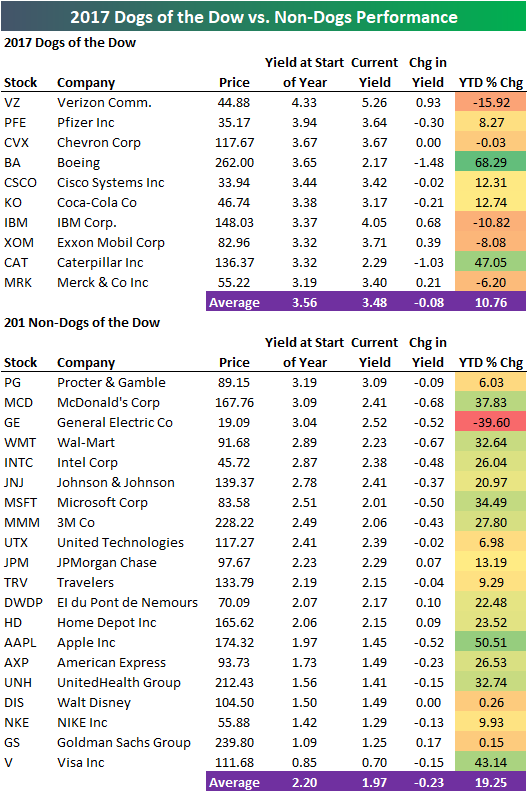
Bespoke provides an update on the famous “Dogs of the Dow” strategy – only about half the gain of the market. Here are the details.
Insight for Traders
Our discussion of trading ideas has moved to the weekly Stock Exchange post. The coverage is bigger and better than ever. We combine links to trading articles, topical themes, and ideas from our trading models. This week’s post illustrated how technical analysis can beat a fundamental approach. Two of the models scored big wins on trades in Restoration Hardware (RH), something that fundamental traders would not have picked. Check out the post to see the reasoning, as well as the current ideas. We continue to track performance on each of the models. And of course, there are updated ratings lists for Felix and Oscar, this week featuring small caps. Blue Harbinger has taken the lead role on this post, using information from me and from the models. He is doing a great job.
Insight for Investors
Investors should have a long-term horizon. They can often exploit trading volatility!
Best of the Week
If I had to pick a single most important source for investors to read this week it would be Chuck Carnevale’s analysis of Aflac (NYSE:AFL), a stock that has increased its dividend for thirty-five consecutive years. Chuck sees it as one of seven “dividend aristocrats” that he regards as fairly valued. As always, he provides a lesson along with the stock pick. This time it is aimed at true value investors:
True value investors are a rare breed, because it takes a special mindset and/or psyche to successfully implement a value investing strategy. This is especially true during major bull markets like we’ve experienced since the 1st quarter of 2009. Common sense would dictate that it is much harder to find attractively valued companies during strong bull markets. Consequently, value typically only manifests during bull markets when a specific company is facing a negative situation. The secret is to determine whether the situation the company is facing is temporary or permanent.
And later…
Additionally, value investors purchasing high-quality companies are prepared to walk through short-term price declines while the company is temporarily out of favor with most investors. In fact, successful value investors understand that finding a perfect bottom is impossible notwithstanding luck. Therefore, accomplished value investors are prepared for and even expect to experience short-term underperformance – unless, of course, they get lucky. As Warren Buffett also once quipped “you can’t buy what’s popular and expect to do well.”
He goes on to explain that some companies attractive on valuation are traps, without immediate upside. I agree with this distinction. I rely on value stocks that include a catalyst in our flagship stock program, but unlike others I also embrace the “value traps.” These stocks are great candidates for the sale of short-term calls, which provide an enhanced income stream from less-risky cheap stocks.
[If either the contrarian value approach, or the prospect of higher yield from cheap stocks is attractive, just write for our free information on these topics. While they describe what I am doing, the do-it-yourself investor can apply the same principles. Both are available for free from main at newarc dot com].
Stock Ideas
William Stamm explains why Home Depot (NYSE:HD) is attractive on many important metrics. This post is like most I feature – a stock idea, plus a lesson in how to analyze.
David Fish updates his “dividend challengers” list. Join me in following him at Seeking Alpha to see his other valuable articles on dividend stocks. As a bonus, David takes a specific look at Broadcom’s valuation (NASDAQ:AVGO), finding it reasonable. I agree.
Financials – Still a value play? (Brian Gilmartin)
AT&T (NYSE:T) is worth a look, says Hale Stewart. Good yield, moderate PE, trading near 52-week low. High payout ratio?
Kirk Spano does a thorough analysis of GameStop (NYSE:GME). No, it is not Blockbuster. You might be surprised at the biggest revenue sources.
Is IBM (NYSE:IBM) a “bargain blue chip?” Barron’s sees signs of a turnaround. Contra – Douglas A McIntyre (24/7). This debate is why I see the stock as a good candidate for generating extra return by writing near-term calls.
Personal Finance
Seeking Alpha Senior Editor Gil Weinreich has an interesting topic every day. While his series’ theme emphasizes financial advisors, the topics are usually of more general interest. His own commentary adds insight and ties together key current articles. It is a valuable daily read. My favorite this week highlights the best role for financial advisors. He cites an article by Ron Surz, who focuses on possible excessive risk in retirement accounts. While I am not on board with all the conclusions, it is certainly a great question.
This is yet another great example of how Gil is helpful both for advisors and for investors.
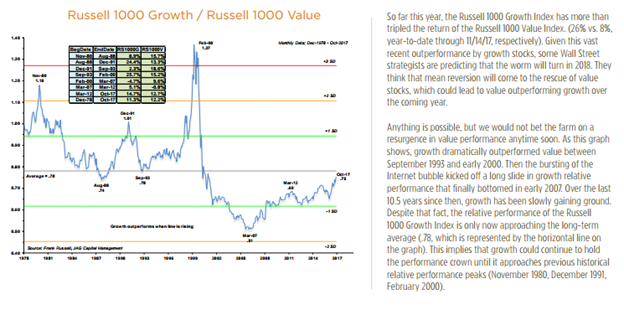
Value Investing was a reasonable approach for 2017, but lagged growth approaches. Brian Gilmartin muses on this question, pointing us to some research from JAG Capital Management.
