The economic calendar is normal, but there will be a lot of competing news – Korean talks, China negotiations, and the Trump legal team’s announcement about whether the President will meet with Special Counsel Mueller. And those are just the items we know about!
Sometimes there are great themes that do not get the deserved attention in financial media. Readers have encouraged me to identify and discuss such themes, and this week provides a good opportunity. Pundits should be asking:
Which equity sectors benefit most from Trump policy changes?
Last Week Recap
In my last edition of WTWA I asked why stocks were “stuck in neutral” given the recent economic strength and the strong corporate earnings. I also noted the significance of the week’s inflation data, even though the Fed’s favorite gauge was not on the calendar. That was all quite accurate. It was the key topic at the start of the week, and stocks responded well to the tame inflation data released mid-week.
The Story in One Chart
I always start my personal review of the week by looking at a great chart. I especially like the S&P 500 version updated each week by Jill Mislinski. She includes a lot of valuable information in a single visual. The full post has even more charts and analysis, so check it out.
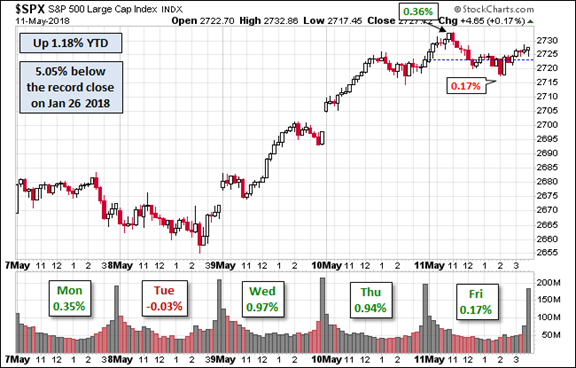
The market had a nice rally, up 2.4% for the week. The trading range was about 3.4%, consistent with recent volatility. I summarize actual and implied volatility each week in our Indicator Snapshot section below. As you can see, volatility has been moving lower, and is back into the long-term range.
The News
Each week I break down events into good and bad. For our purposes, “good” has two components. The news must be market friendly and better than expectations. I avoid using my personal preferences in evaluating news – and you should, too!
Feel free to add items that I have missed. Please keep in mind that we are looking for current news, especially from the last week or so. WTWA is not about long-term concerns like debt. These are important, of course, but not our weekly subject unless there has been some major change.
The overall picture remains positive. Economic strength is reasonable, and inflation is low. New Deal Democrat’s analysis of high-frequency indicators shows some deterioration but retains the overall outlook.
The Good
- NFIB small business optimism nudged higher to 104.8 vs. 104.7 last month and expected. The record of improved profits was the highest in the 45-year history of the survey. (NFIB)
- Hotel occupancy is on pace for a record year. (Calculated Risk).
- Bank lending is getting easier. New Deal Democrat notes that an ongoing criticism of the economy has been the deceleration of commercial and industrial loans. The Senior Loan Officer Survey tends to lead lending by about six months. He concludes, “Credit remains loose, and indicates continuing economic growth over the next 12 months”.
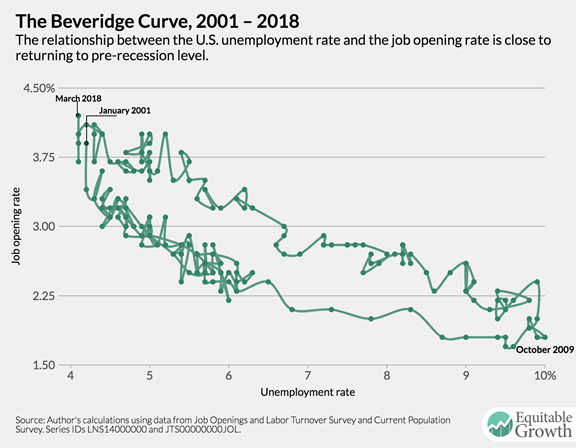
- JOLTS showed labor market strength. Nick Bunker provides the best analysis of this report, covering and interpreting all the key elements. This month there is a small rebound in the quits rate, the all-time low of the ratio between unemployed workers and open jobs, and the overall structure represented in the Beveridge curve.
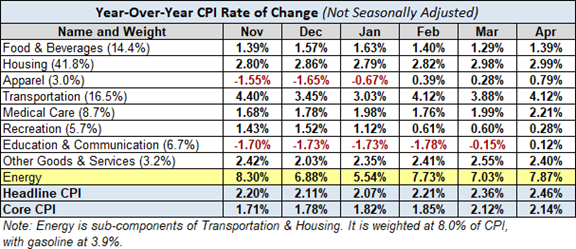
- Inflation remained tame. The PPI increased 0.1% with the core up 0.2%. The CPI increased 0.2% with the core up 0.1%. These reports comforted observers who are concerned about Fed rate hikes. Jill Mislinski provides an “X-Ray View” of inflation component using year-over-year changes instead of seasonal adjustments. James Picerno observers that the data are unlikely to influence Fed policy.
- Initial jobless claims matched last week’s low of 211K and beat expectations of 220K.
The Bad
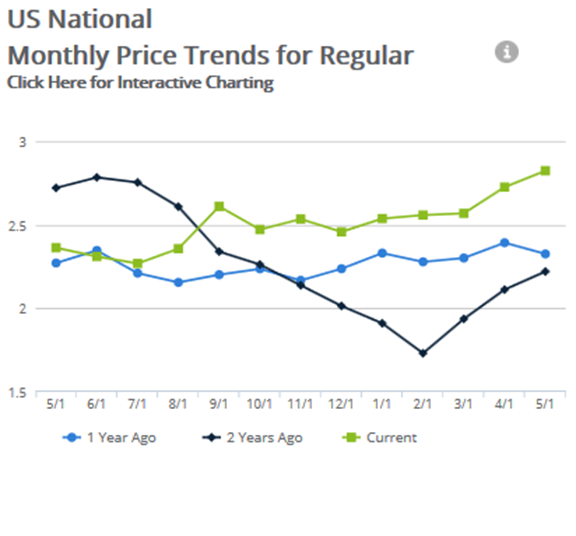
- Oil and gasoline prices move higher. Iran sanctions, the Venezuelan economic crisis, and seasonality are all factors. (MarketWatch)
- No progress in the US/China trade talks. Some were optimistic since the delegations included top-level officials. (NYT)
The Ugly
The Central States Pension Fund is expected to be insolvent in seven years. (Michelle Jones, VW) Some businesses in the plan have failed, and investments have not met expected returns.
The Week Ahead
We would all like to know the direction of the market in advance. Good luck with that! Second best is planning what to look for and how to react.
The Calendar
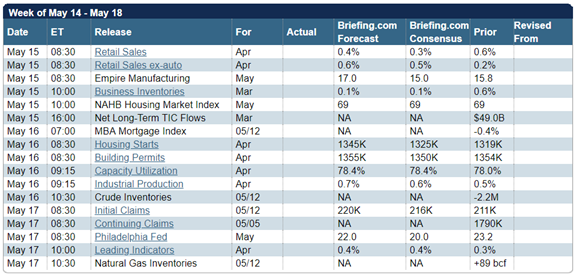
The economic calendar is normal, with an emphasis housing data. Retail sales and industrial production are important, and some swear by the leading indicators. Geopolitical and investigation news may once again claim the spotlight.
Briefing.com has a good U.S. economic calendar for the week (and many other good features which I monitor each day). Here are the main U.S. releases.
Next Week’s Theme
It may well be a big week for news, but there is no clear focus for the punditry. Don’t worry. They will find a way to fill the air time. I am taking the occasion to discuss a topic that should be getting more attention. Pundits and financial writers should be asking:
What sectors benefit most from the Trump policy changes?
Please note that this is an investment question, not a political one. A good investor is politically agnostic but must also be realistic. Policy changes are facts and the gauging the likely investment impacts is analysis. We know much more about Trump policies than we did at the start of his term. There are several key effects worth further research. In the list below, I sometimes include a link which provides a viewpoint or analysis as a starting point. The links do not necessarily represent my personal views. Good research requires considering all sides. I have included (in brackets) a few comments of my own. The topics are all worth further study with significant investment implications.
- Trade policy. Fortune’s CEO Daily is one of my daily reads. Today there was an excellent summary of the China trade situation with links taking a US viewpoint and a China viewpoint. The source material included a pro-China article from the FT, and a pro-US article from the WSJ.
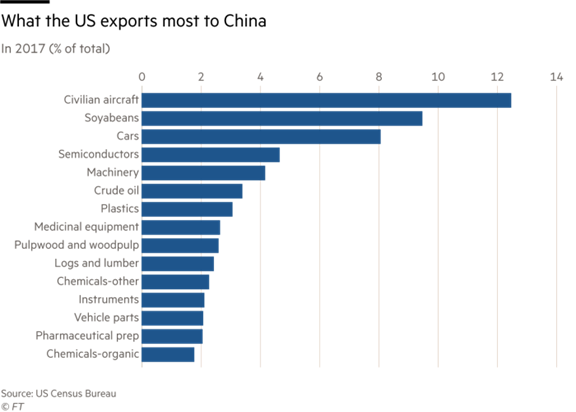
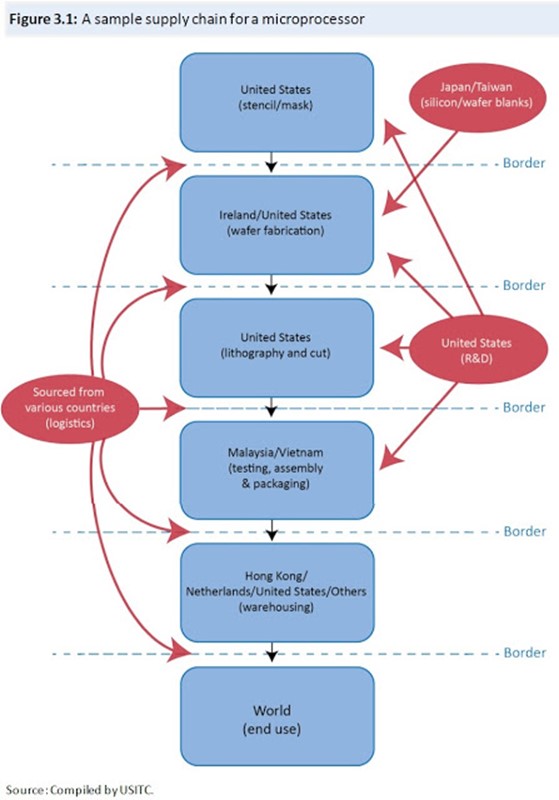
The estimates of the hit to GDP is a reduction in growth of 0.3% for China and even less for the US. Could the trade conflict expand? Timothy Taylor considers the overall economic effects of US Import restraints. Few understand that many products have a complicated history of contributions and cross many borders. Here is a fascinating example.
- Housing. Construction costs are increasing – both materials (Calculated Risk) and land. The WSJ suggests that the next housing crisis could be a “historic shortage of new homes.” Lumber prices are higher partly because of the tariff on Canadian imports, in retaliation for their tariff on US milk. Regulations restrict development in many areas. Interest rates are a bit higher. [I still like this sector because of the demographic forces and obvious need for more supply. There is always a market-clearing price.]
- Energy prices. Increases might threaten the US economy (Barron’s), but will be good for some companies.
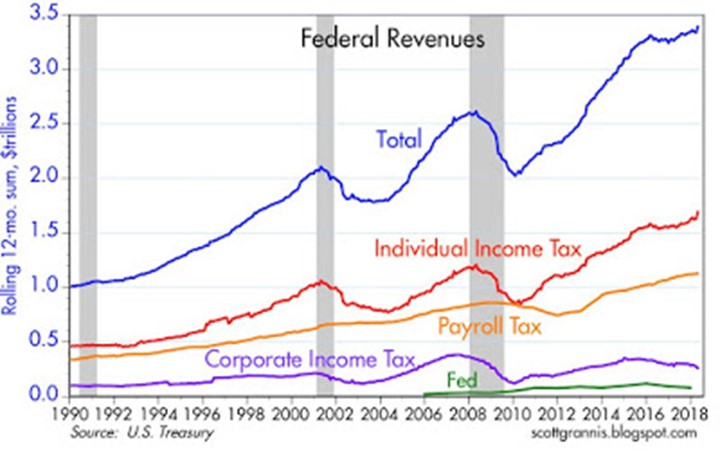
- Tax policy. Scott Grannis notes that tax revenues have increased, a result he attributes to the lower rates from the “Trump tax cut.” He suggests, “With just the tiniest bit of spending restraint, we could see the budget deficit hold steady or decline between now and year end”. [It is pretty early in the game to draw conclusions here].
- Economic growth. Looking a bit better with current “nowcast” results of 3-4%. Worries? Immigration limitations hit potential growth as do trade restrictions. In total, these may reduce GDP by more than 1%. [We are still headed for solid growth, but it will be less than it might have been].
- Net neutrality. Under FCC control, and the Trump panel ended the policy. The Senate may force a vote on this issue, but it appears to be mostly symbolic. (Brookings). [I originally expected serious Congressional resistance, but it never really developed].
- Drug prices. This week’s big announcement about lowering drug prices was met with relief from the industry. [My long-term opinion has been that the demand for important drugs is strong; the balance between development costs and price must be addressed. Finally, the President has little power, beyond the bully pulpit, to have a big impact. So far, the stocks reflect the political commentary.]
As usual, I’ll save my overall personal conclusions for today’s Final Thought.
Quant Corner
We follow some regular featured sources and the best other quant news from the week.
Risk Analysis
I have a rule for my investment clients. Think first about your risk. Only then should you consider possible rewards. I monitor many quantitative reports and highlight the best methods in this weekly update.
The Indicator Snapshot
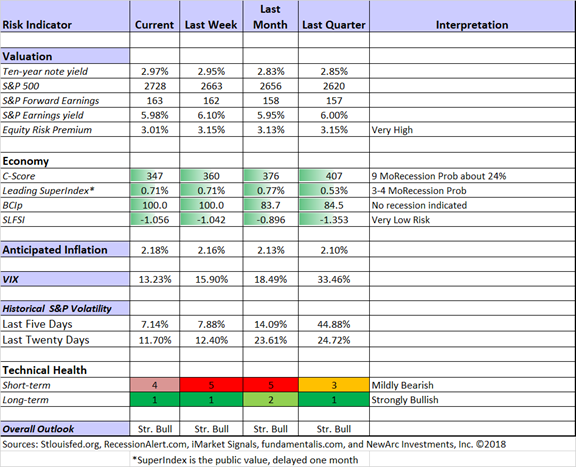
Short-term trading conditions have improved. The borderline rating was almost poor enough to take our trading models out of the market. A strength of our modeling approach (Thanks, Vince!) is a touch more patience than shown by many technical systems. This has a mild cost, and can reap great rewards. This week was a good example. We continue to monitor the technical health measures on a daily basis. The long-term fundamentals and outlook are little changed.
A notable feature of the chart is that we have increased the nine-month recession odds to a chance of 25%. While this is significantly higher than it has been during the rally, it does not yet represent a real threat. Instead of thinking of the odds as higher than before, we must keep in mind the continuing evidence that a near-term recession is unlikely. The odds are only slightly higher than the long term average.
That said, we watch this quite closely and plan to reduce position sizes if the risk grows much larger.
The Featured Sources:
Bob Dieli: Business cycle analysis via the “C Score.
RecessionAlert: Strong quantitative indicators for both economic and market analysis.
Brian Gilmartin: All things earnings, for the overall market as well as many individual companies.
Georg Vrba: Business cycle indicator and market timing tools. None of Georg’s indicators signal recession.
Doug Short and Jill Mislinski: Regular updating of an array of indicators. Great charts and analysis.
Guests:
Ben Leubsdorf (WSJ) reporting the results of the latest WSJ poll of private sector economists. He does a nice job of describing and analyzing the conclusions, but his lede is that the expansion is likely to end in 2020. (This was the conclusion of 59% of those surveyed).
I made a polite objection on Twitter, noting that no one could forecast a recession more than a year ahead of time, and that the age of the economic cycle was not predictive. I got a polite reply, but I understand that his job is to report the WSJ survey. There must be a better process for covering recession potential. You could, for example, focus on those with special expertise on this topic, instead of looking to generalists.
James Picerno does his annual look at those predicting recessions. Read the entire post to see the range of speculation lacking method. Read the prior two installments to see some “forecasting” history. As I have also recently noted, he sees the bogus forecasts as moving farther out in time to improve the odds.
Insight for Traders
Check out our weekly Stock Exchange post. We combine links to important posts about trading, themes of current interest, and ideas from our trading models. This week we asked fellow traders if they had a real strategy. The key comparison is between a “line on a chart” and interpretive analysis from Dr. Brett Steenbarger. In addition to this customary educational segment, we discussed some stock ideas and updated the ratings lists for Felix and Oscar, this week featuring the S&P 500 stocks. Blue Harbinger has taken the lead role on this post, using information both from me and from the models. He is doing a great job, presenting a wealth of new ideas and information each week.
While I emphasize trading in the Stock Exchange series, it often has implications for long-term investors. It is worth a visit.
Insight for Investors
Investors should have a long-term horizon. They can often exploit trading volatility! I remind investors of this each week, but now is the time to pay attention.
Best of the Week
If I had to pick a single most important source for investors to read this week it would be behavioral scientist Steve Wendel’s article, Biases Don’t Make Investors Foolish. He takes four of the common cognitive biases and shows why they are useful in everyday life. He has a great example of how well they work on hamburgers. Feel free to substitute your favorite food, he invites. He then applies the same useful heuristics to investing. I cannot quote much without giving away the whole story, so please read this excellent, brief post.
The decisions our minds make, which we call biases in the context of investing, are actually quite smart. Investment biases are smart shortcuts, applied to the wrong situation. Thus, there’s a very good reason why they are difficult to overcome: they generally help us. Since we can’t simply ignore them or easily override them, we have to acknowledge them and work with them or around them. Everyone has them: advisors, fund managers, pension investment committees, etc. Our investment biases are a natural part of how our minds are wired; they don’t disappear because someone has a particular base of expertise in investing.
This article provides an excellent test of what you need to do to be successful as an investor – or as a financial advisor!
Market Outlook
Avondale Asset Management covers earnings calls by reviewing transcripts and presentations. This is an excellent source for those of us wondering whether economic growth is reflected in corporate profits. This week’s report highlights overall optimism, solid growth, a strong labor market, and a CEO expectation that the business cycle could continue for several more years. They love tax reform but are feeling some cost pressures.
Corporate buybacks are bullish for investors. (Barron’s cover story). Andrew Bary’s analysis is thorough, looking at many stocks and considering counter-arguments in an even-handed way. Buybacks add an effective “yield” of about 3%, combined with a 1.9% dividend yield on the S&P 500.
Stock Ideas
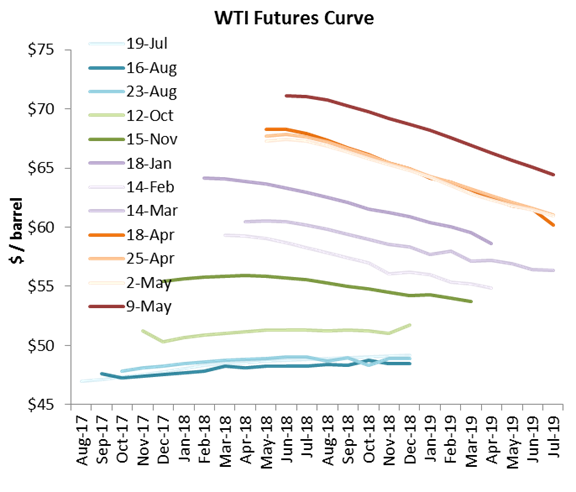
Energy stocks? Princeton Energy Advisors (HT Calculated Risk) considers both increasing demand and the potential supply additions. The conclusion: “Equities still look to have plenty of running room ahead of them.” The futures forward curve shows the history of each futures contract. The overall levels have increased dramatically, and there is “backwardation” in each contract. This means that for any given contract, the price is lower in the future.
A rebound in Synaptics (NASDAQ:SYNA)? Shareholders Unite discusses the company’s plan for diversifying from the mobile phone and into the IoT.
Some high-dividend ideas from Colorado Wealth Management.
Value investing
James Picerno analyzes recent trends, concluding that any rebound in value investing seems to be concentrated in smaller-cap stocks.
Personal Finance
Seeking Alpha Senior Editor Gil Weinreich has expanded his excellent series for financial advisors (and serious individual investors) to include some podcasts. This week I especially enjoyed his timely post, An Intriguing Investment Recommendation. He expands on Rob Marstrand’s suggestion about investing in South Korean stocks. He presents a nice account of the tension in 2017 and the current improving relations. It is an object lesson in why it is often profitable, but very risky, to buy at times of maximum stress. Patience may lead to a better balance between the two.
Abnormal Returns is always worth reading, with many links on an array of interesting topics. Wednesday the focus is on personal finance. There always several good choices. My favorite this week is a Bloomberg story (Katherine Chiglinsky and Ben Steverman) on annuities. A key sentence, quoted from a financial advisor: “Historically, insurance products have been sold and not bought.” The commission structure and different regulations for insurance agents have given these products a bad name, even though it may be appropriate for some.
Watch out for…
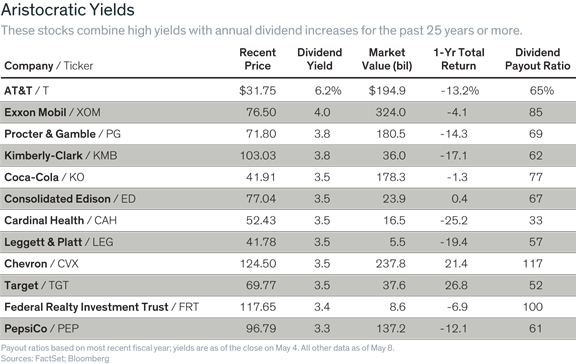
Elite dividend stocks? Barron’s notes that the yield sometimes comes at the cost of a lower stock price. There has been extra pressure on some with the highest yields. The article has a good analysis of what to look for.
Pacific Gas and Electric (NYSE:PCG). Hale Stewart describes the company’s problems related to last fall’s wildfires. He notes that the risk remains very real.
Final Thoughts
Finding attractive stocks is easier when you have the demographic, political, and economic winds at your back.
While I certainly do not have all the answers about the impact of Trump policy initiatives, there is now some clarity. Here are some strong approaches:
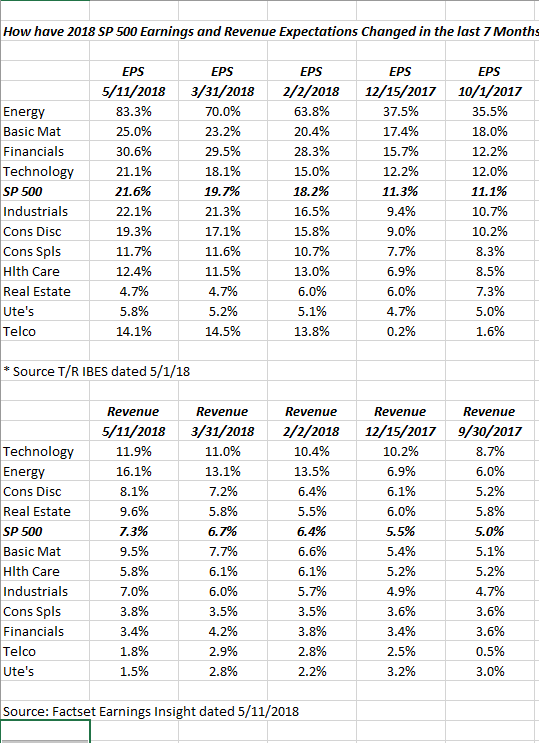
- Spot improving sectors. Some have benefited while others have not. Brian Gilmartin describes how the sector earnings and revenue estimates have changed. This is a factual, non-political account – just the kind of information we seek. While all sectors have improved, there are some clear-cut winners and laggards.
- Get ahead of the capital flows. “Davidson” (via Todd Sullivan) notes that these flows always occur after events become well known. He analyzes in detail the relationship between the dollar, oil prices, and the perceived economic effects. He concludes:
Current trends in multiple economic indicators (covered in recent notes) speak to continued global economic expansion. The pace of this expansion is likely to surprise many by its strength. Recent earnings reports and forecasts for the next few years by well known and respected CEOs in multiple sectors remain very positive. The current gloom should dissipate fairly quickly.
- It is important to look beyond absolute prices of individual stocks and the market. If avoiding new highs was your only investment rule, you could never participate in a rising market! Dr. Ed Yardeni notes:
The forward P/E has been very noisy so far this year on fears of higher inflation, tighter Fed policy, and trade protectionism. It has masked the underlying bullish trend of the S&P 500 forward earnings. Thanks to Trump’s tax cuts at the end of last year, this weekly measure of industry analysts’ consensus estimates for earnings over the coming 52 weeks has been soaring since the start of the year.
My Boom-Bust Barometer (BBB), which is the ratio of the CRB raw industrials spot price index to initial unemployment claims, continues to be highly correlated with S&P 500 forward earnings. The BBB rose to a record high at the end of April. The BBB is also highly correlated with the S&P 500 stock price index, but less so than with forward earnings. That’s because there is more noise than signal in the S&P 500 than in forward earnings as a result of the short-term volatility of the P/E.
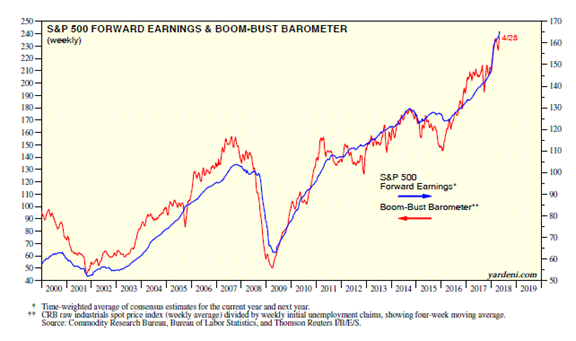
Focusing on price alone is a serious but common mistake.
If that sounds familiar, send for my free paper on the Top Investor Pitfalls. Whether you are trying to preserve wealth or to build your assets, there are some great opportunities right now. If you are having trouble pulling the trigger, organizing your thoughts, or finding attractive stocks, send a note to main at newarc dot com. I have written papers on each of these topics. We will happily send some free resources and provide a consultation if you wish.
I’m more worried about:
- Iran. It appears that the European allies may split with the US. The chance for retaliation is higher. Most experts question whether bilateral negotiations are possible.
- Deterioration in the tariff and trade talks. The high-level meetings have produced no progress on an issue of great economic significance. The market rates this as a bigger threat than do economic analysts. I agree with the market.
I’m less worried about:
- North Korea. The upcoming Summit provides an attractive opportunity. Perhaps the time is finally right.
- Technical market concerns. Those watching charts got some relief last week.
