Apple (NASDAQ:AAPL), Facebook (NASDAQ:FB) and Microsoft (NASDAQ:MSFT) report their December, 2019, quarter this week, and given the importance of the stock’s to the indices, the results will be closely watched.
141 S&P 500 components are expected to report their Q4 ’19 results thus by the end of the week, so just over 220 of the S&P 500 will have reported by January’s end.

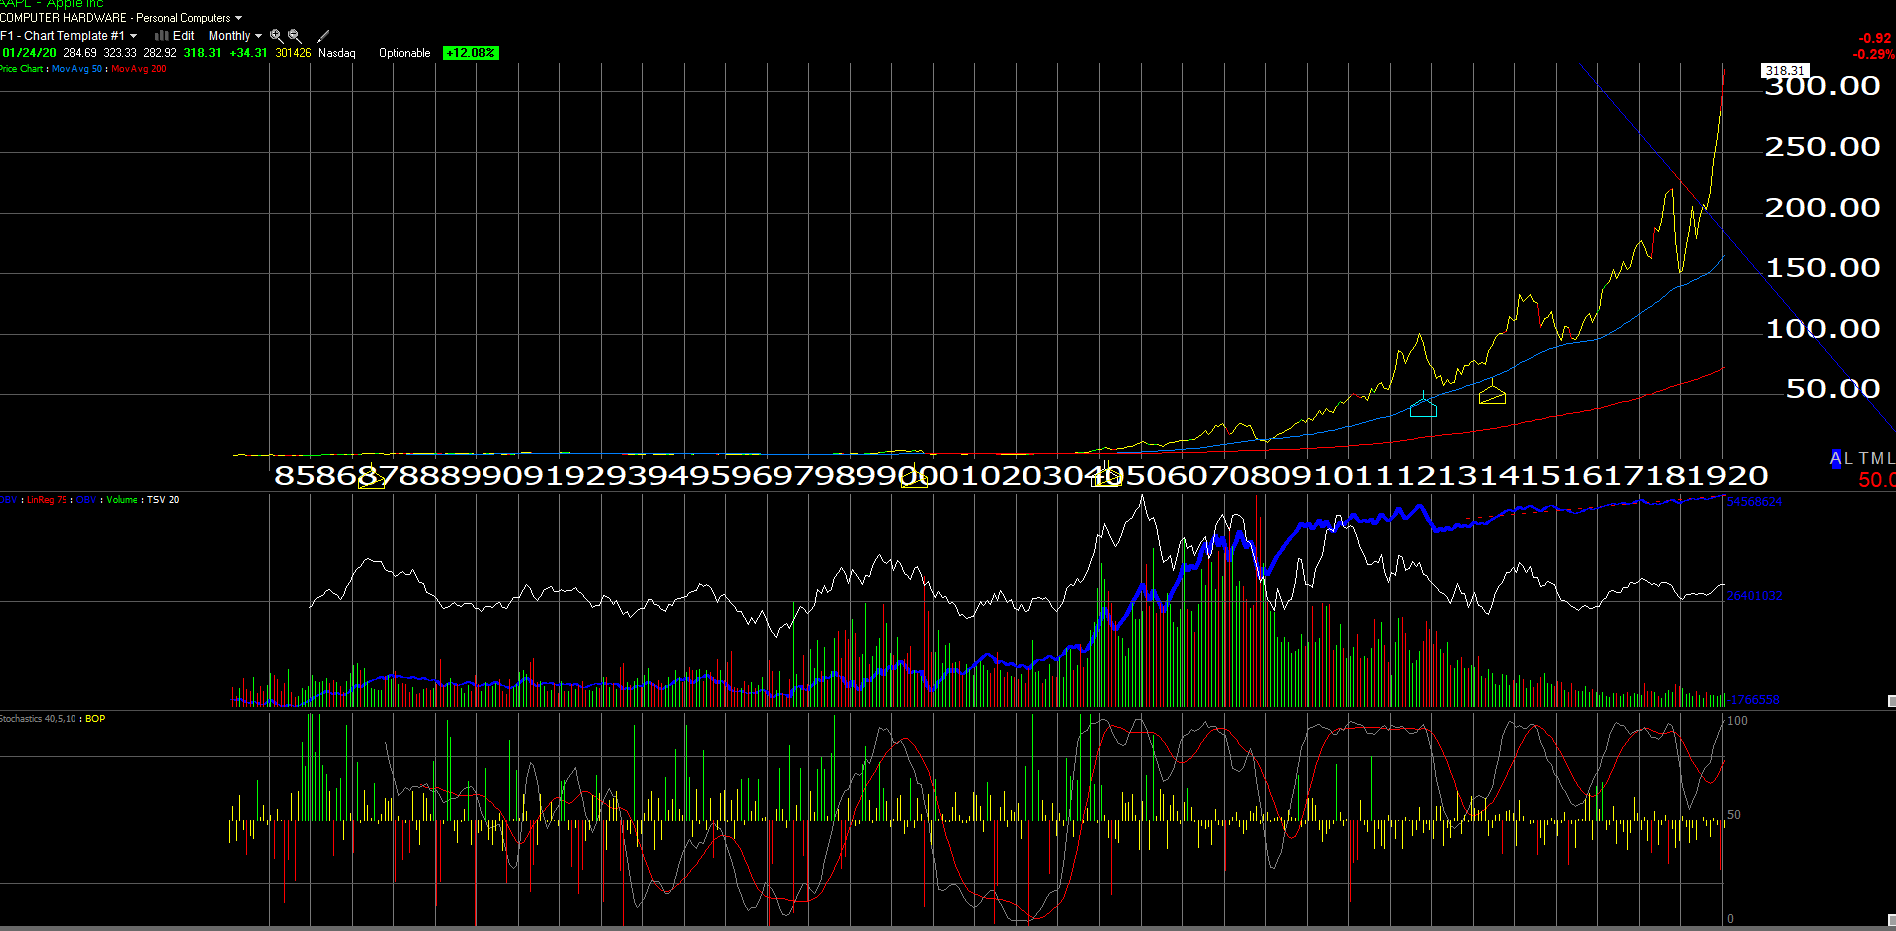
Apple’s the big dog in the yard right now, closing Friday, January 24th, 2020 at a $1.395 trillion market cap, and looking very overbought on the chart.
That’s a monthly chart of Apple and this latest move looks parabolic in nature, but to be honest about the scenario to readers, Apple was sold from client accounts in May ’18 between $160 – $170 per share in many (but not all) client accounts, thus I don’t want this to sound like sour grapes, or justification of the sale decision.
The reason for the Apple sale was this, but despite the fact that many of these metrics have yet to change or improve dramatically, the stock has traded up from $175 to $315 coming into Tuesday night’s release.
Always thinking about how we do what we do for clients this January, 2020 article on Apple help me understand better what has transpired with Apple. The fact that Apple has basically transformed their business model on the fly from a Tech Hardware to a Services business to me remains quite remarkable, after seeing what the 1990’s Tech giants endured for over a decade.
Some might argue with that statement though since “Services” grew from 21% to 27% of total revenue in fiscal ’19. The fact is the iPhone is still a big chunk of Apple’s total revenue.
Here is what Apple’s cash-flow (and free-cash-flow) coverage of net income look like currently:

It was the trend that was worrisome along with the rest of the deteriorating fundamentals in early to mid-2018. Both have stabilized now.
Here is the degree of PE expansion that had occurred in calendar, 2019:

The magic formula for growth stocks is rising EPS and revenue estimates (positive revisions) and a rising multiple. Apple’s had ’em all the last year.
Apple’s EPS weight within the Tech sector is huge – 20% – after the creation of the Communication Services sector. There will be a post on this Monday.
S&P 500 Weekly Earnings Update:
Forward data:
Trailing data:
Summary / conclusion: It’s a big week for mega-cap Tech, and Apple in particular. There has been a lot of discussion about Apple being “revalued” from a Tech hardware to a Services business with higher gross margins, but mid-single-digit revenue growth. 45% of the S&P 500 will have reported by the end of January ’20, so we’ll take a look at the end of the week, on how 2020 estimates have changed for the S&P 500.
Thanks for reading.
