REVIEW
The holiday shortened week started off at SPX 2068 on Monday. After a rise to SPX 2074 by Tuesday the market dipped to 2065. Then after rise to new highs at SPX 2076 on Friday, this was followed by another dip to 2065. The total range for the week was an incredibly small 0.5%. For the week the SPX/DOW gained 0.15%, the NDX/NAZ gained 1.85%, and the DJ World index gained 0.10%. Despite the small rise, this was the sixth weekly gain in a row. On the economic front reports came in biased to the negative side. On the uptick: Q3 GDP, personal income/spending, the PCE, and durable goods orders. On the downtick: consumer confidence/sentiment, Case-Shiller, the Chicago PMI, pending/new home sales, the WLEI, and weekly jobless claims increased. Next week we get the FED’s beige book, the monthly Payrolls report, the ISMs, and plenty more.
LONG TERM: bull market
We spent much of this quiet trading week discussing potential wave counts, in the OEW forum, using the quantified trends. The four major US indices, and two broader based indices, were reviewed from several different angles. A few feel the fundamental weaknesses, mainly abroad, do not support an ongoing extension of Primary III, and in some cases, an ongoing bull market. Technically, we were mainly concerned with the underperformance of the NYSE index, and the DJ World index. During the past several weeks the four major US indices have rocketed to new all time highs. Meanwhile, only Switzerland has made higher highs in Europe; and China, India and Japan have made higher highs in Asia.
The discussion began with four different counts that individuals within the group have been tracking separately. During the discussion no additional counts were added. In order to qualify as a viable count, each of the counts had to fit the exact quantified wave patterns of all four major US indices, and one of the broader based indices. The discussion concluded on Friday with three of the four counts meeting all the criteria. The last one, which happens to be the irregular Major wave B in Primary IV, was dropped. This uptrend is far too impulsive to continue to envision that possible scenario.
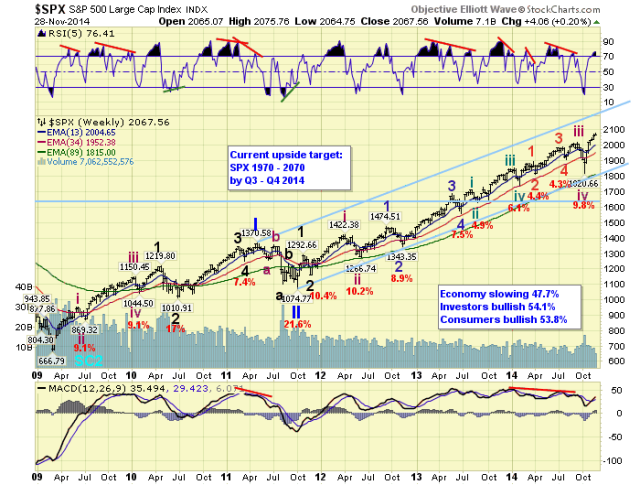
Of the three remaining counts the one I believe is supported by the fundamentals and technical I track, is posted on the SPX charts. An ongoing Primary wave III, currently in an Int. wave v of Major 3 uptrend. This count is also posted on the NDX charts.
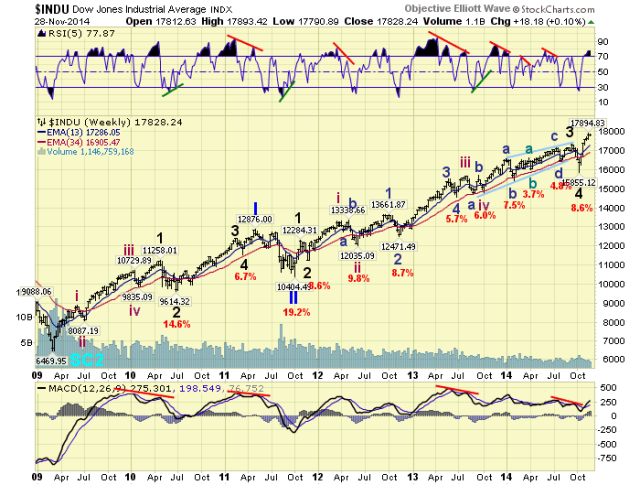
The second count which appeared to get the most support is now posted on the DOW and NYSE charts. This count suggests the market is currently in a Major wave 5 of Primary III uptrend. While it may look like the market is headed for a Primary III top, most feel Major wave 5 will subdivide into at least five Intermediate waves.
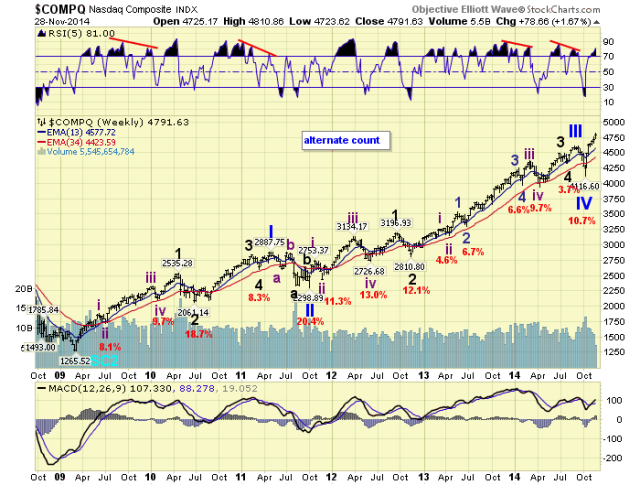
The third count which also qualified is posted on the NAZ charts. This count suggests Primary wave III did top in September and Primary IV bottomed in October. And the market is currently in Primary V. Somewhat supporting this scenario, but currently looks to be a bit out of sync, is the count posted on the DJW charts. The combination of the two counts suggest we are currently still in a Primary IV globally, but the US has already started Primary V.
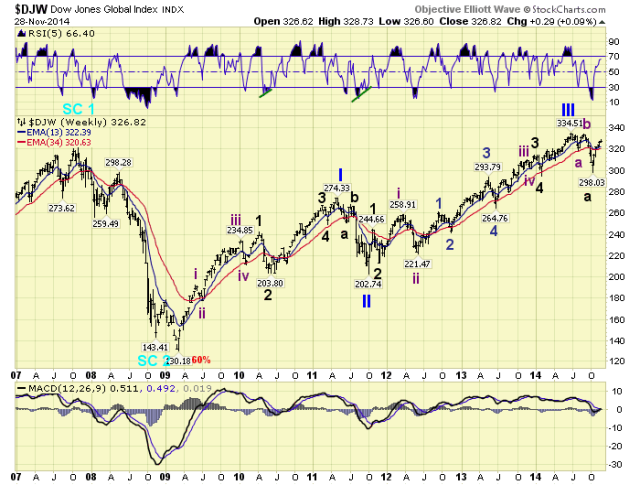
In conclusion we can only state that the US and global markets are at a major inflection point in this bull market. Over time, the counts that do not fit future market activity will fall away, and the remaining count will be the market’s count. This is not to say this is a period of confusion. We can only project, monitor and adjust when necessary. Currently I give the first count, SPX, a 40% probability, and the other two counts each a 30% probability. Since investing is about choice. Feel free to embrace whichever count appeals to you, individually. At times like these, we can only deal with probabilities and then discover what unfolds.
MEDIUM TERM: uptrend
While we noted three potential long term counts in the section above, we will concentrate in the following sections on the primary count. After the SPX topped at exactly the 2019 pivot in September the market sold off to within the 1828 pivot range in October. This uptrend high and downtrend low are being counted as the end of Intermediate wave iii, and all of Intermediate wave iv, of Major wave 3.
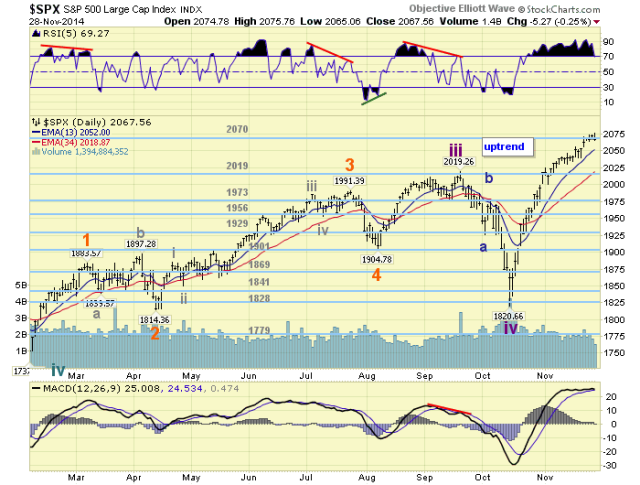
The early stages of this uptrend were quite explosive as the market formed a V shaped bottom in October. However, once October ended the uptrend shifted into a more gradual advance throughout the month of November. While this uptrend has unfolded it has remained overbought on the daily RSI for over one month. This has never occurred before during the entire bull market.
Medium term support is at the 2019 and 1973 pivots, with resistance at the 2070 and 2085 pivots. We are, however, nearing an important Fibonacci wave/price cluster: SPX 2078-2084. Within this range, Minor 5 is in relationship to Minor 1, Int. v is in relationship to Int. i, and Major 3 is in relationship to Major 1. Should the market clear this range, and the 2085 pivot, the 2131 pivot would be next.
SHORT TERM
We have been counting this uptrend with five Minor waves: 1898-1878-2046-2030-2076 thus far. Minor 3 divided into five Minute waves, and Minor 5 appears to be doing the same: 2056-2040-2076-2065 thus far. When Minute wave iv concludes, which should be at/above SPX 2056, a Minute v to higher highs should be underway. We would expect the next series of new highs will top within the OEW 2085 pivot range. Should the market drop below SPX 2040 prior to that, then it possible the five Minor waves had already completed. The next correction, should the count be correct, should drop between 5% and 10% from the market high.
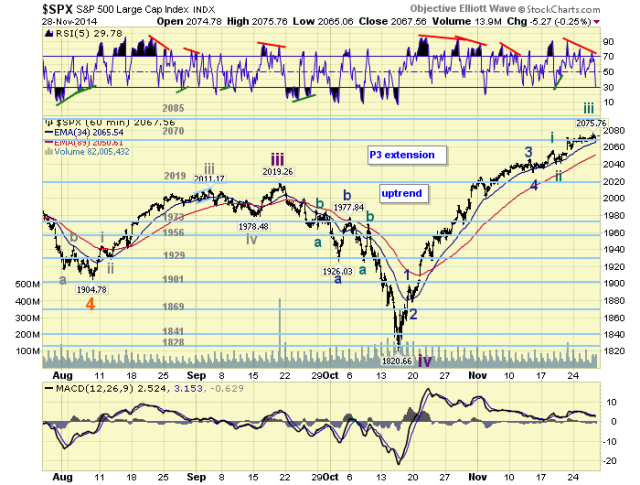
Short term support is at SPX 2056 and SPX 2040, with resistance at the 2070 and 2085 pivots. Short term momentum created a negative divergence at Friday’s high, then ended the week at oversold with the pullback. Best to your trading in what could be a volatile week.