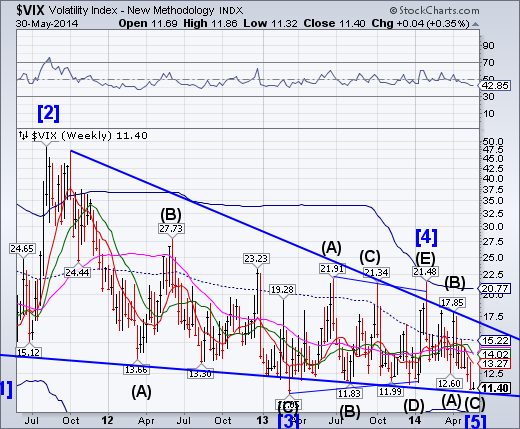
The VIX appears to be making afinal and deeper low, challenging its March 15, 2013 low at 11.05before reversing.The rate of descent has slowed considerably and the Cycles Model suggests an imminent launch higher.
SPX made a new all-time closing high
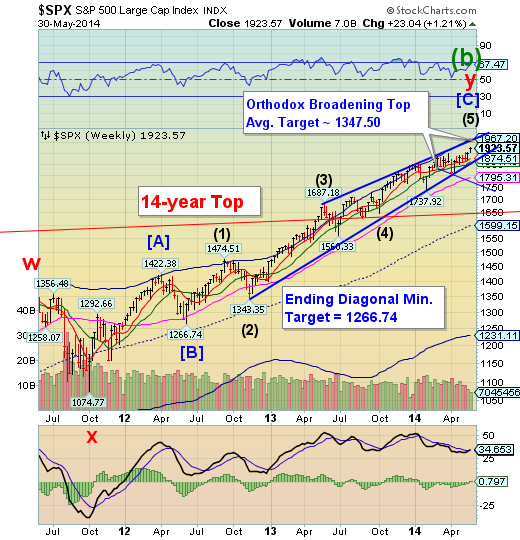
SPX made a new, all-time closing high.A reversal may be made by simply declining beneath its Ending Diagonal trendline and weekly Short-term support at 1874.51.The combination of all-time highs and extreme VIX lows may be a ticking time bomb.
ZeroHedge: Q1 GDP growth in the US was simply abysmal - its worst in 3 years - but that does not matter as hope springs eternal that Spring is sprung and it's all green shoots from here. However... that's not what we are seeing in personal spending data (biggest miss in over 4 years in April) and now Bloomberg's Orange Book which implicitly tracks CEO Confidence via their comments has dropped back to the year's lows - not what we are being told by the talking-heads who promulgate the hockey-stick faith in our central planners.
NDX makes a new high
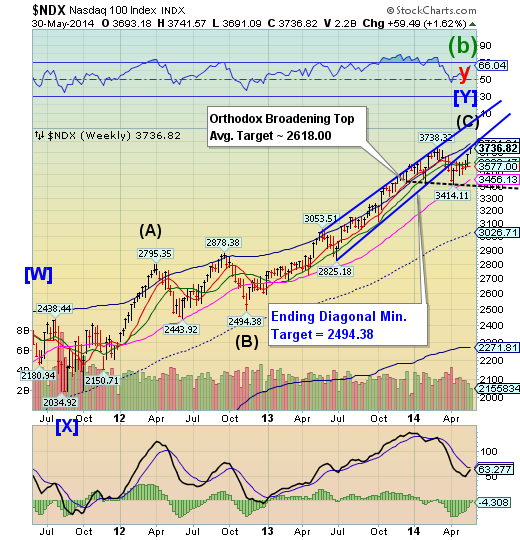
NDX made a new high, nullifying its potential Head & Shoulders formation.It has run up again to the lower trendline of its Ending Diagonal formation, challenging its Cycle Top resistance at 3761.61.This leaves an Orthodox Broadening Top formation, which is a cousin to the Head & Shoulders formation, but potentially more bearish.
ZeroHedge: Dow Transports were the best performing US equity index in May, rising 5.5% - the best May in 23 years (and best month since Oct 2013). The Dow and Russell 2000 also managed to scrape out gains for May. May also saw bond-buying (the best month since Jan) and gold-selling (worst month since Dec). Treasuries flattened for the 3rd month in a row as 2s30s dropped to 1 year lows. On the week, stocks soared (as "most shorted" were squeezed to death - best 2-weeks in 2014) but VIX has its best week in the last 5, bond yields tumbled and the curve flattened (10Y -8bps, 2Y +2.5bps), gold and silver were clubbed (down 3-4%) for the worst week in 8 months. Amid all this angst the USD ended unch.
The Euro stabilized above Long-term Support
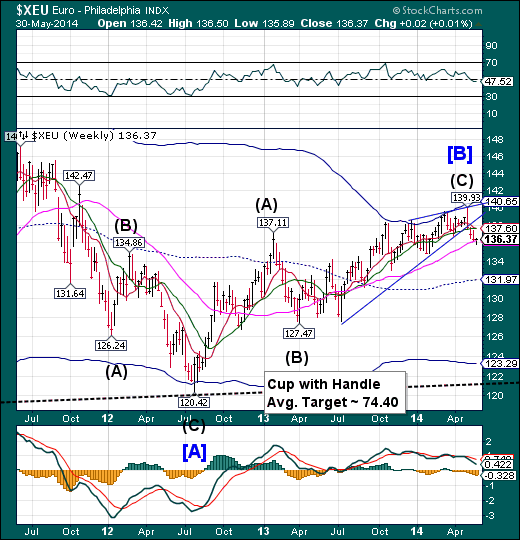
The Euro stabilized just above weekly Long-term support at 136.22. It is likely to bounce back to Intermediate-term resistance before resuming its decline.EndingDiagonals are usually fully retraced, so we may expect a minimal decline to 127.47, with a high probability of testing its weekly Cycle Bottom at 123.29.
Bloomberg: The euro was set for its biggest monthly drop in a year against nine major peers amid speculation the European Central Bank will expand easing next week.
The shared currency traded near a three-month low against the yen before a report next week forecast to show inflation in the euro area remained below 1 percent, less than half the ECB’s goal. President Mario Draghi said this month he’s “comfortable” to act in June.
EUROSTOXX goes higher
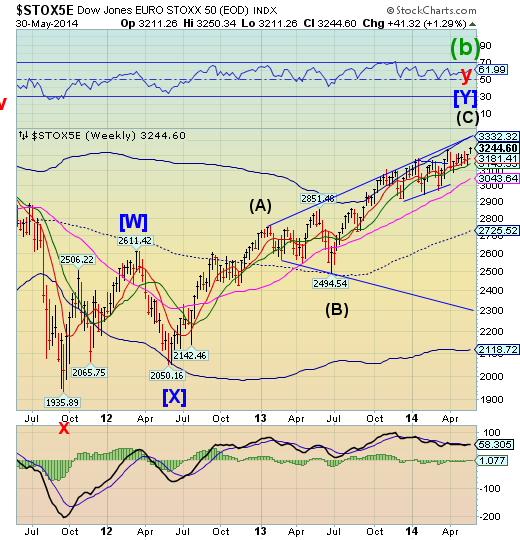
The EuroStoxx 50 index made a new high on waning momentum.Thursday’s high was an inverted Trading Cycle high that leaves the opportunity for a reversal into the end of June.
ZeroHedge: Just as we had warned in the run-up to the European elections - and England's UKIP victory in local elections had suggested;Anti-European-Union parties are showing strongly in this weekend's elections. Anxiety is spreading among the status quo as Greece's anti-austerity party SYRIZA wins and perhaps even more worryingly in supposed core of the union France's Nationalist party is leading in a "political earthquake" success:
-
EUROPEAN GOVERNMENTS MUST RESPOND TO CITIZENS' ANGER: VALLS
-
FRANCE'S VALLS SAYS 'SITUATION IS GRAVE FOR FRANCE, EUROPE'
-
DRAGHI SAYS PEOPLE VOTING ACROSS EUROPE ARE CLEARLY DISENGAGED
Disengaged? - or totally pissed off with promises that never materialize and wealth that only trickles down to the uber-richest and uber-elitist.
No wonder France is worried
The Yen consolidates beneath Long-term resistance
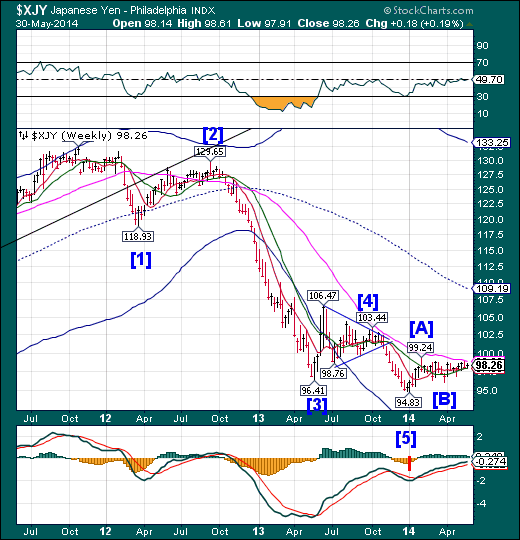
The yen is getting squeezed between Intermediate-term support at 97.88 and Long-term resistance at 98.92. This may resolve the three-month-long sideways consolidation, which is a coiling action that often results in a continuation of the move preceding it. Should traders start to view the Yen as a safe haven during political and economic turmoil, the money flow may reverse course and move from stocks to currencies such as the Yen.
Reuters: The yen leveled off on Friday but still looked set to rack up its best gains for months after a jumbled week of currency moves that has broadly seen the dollar strengthen and the euro and sterling fall.
Attention is now firmly focused on next week's European Central Bank policy meeting, expected to deliver more policy easing. It comes at a time when the conviction of many that the Bank of Japan would do similarly this summer has been shaken, underpinning the rise for the yen to three-month highs against the euro.
The Nikkei 225 bounces a third time from its Head & Shoulders neckline
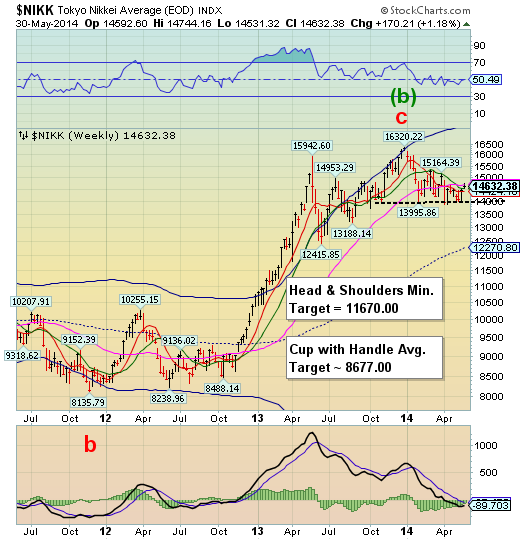
The Nikkei stalled just beneath weekly Long-term resistance at14685.52.Unable to go higher, it awaits a catalyst to act on. Sideways consolidations such as this are usually continuation patterns. The longevity of the right shoulder introduces the Cup with Handle formation that is not exclusive of the other formation.
TheEconomist: THE mantra since Shinzo Abe returned to office in 2012 has been about pulling Japan out of its long deflationary spiral. But that is much easier said than done when the population is ageing and shrinking more rapidly than any other.
In May a think-tank predicted that within a little more than three decades some 1,000 rural towns and villages will be largely empty of women of childbearing age. The government forecasts that Japan’s overall population, currently 127m, will shrink by a third over the next 50 years (see chart below). Indeed, it predicts there will be a mere 43m Japanese by 2110. The latter forecast is unscientific extrapolation—no one can possibly know what the country will look like a century from now. Still, the forecast is a measure of the government’s mounting alarm, and it is hard to square with the prime minister’s notions of returning Japan to national greatness. In short, demography is once again coming to the fore as a hot political issue.
US Dollar challenges Long-term resistance
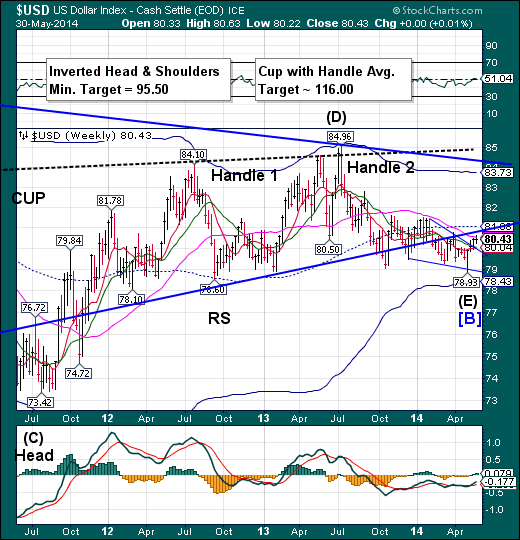
The dollar challengedLong-term resistance at 80.62as it appears poised to continue its rally. A breakout above, mid-Cycle resistance at 81.08 cyclically confirms a probable new uptrend.
MarketWatch: The dollar fell against the euro and British pound on Friday but notched monthly gains against both rivals in May.
The ICE dollar index DXY -0.14% , which pits the greenback against six rivals, fell to 80.379 from 80.491 late Thursday. In May, the index gained 1.1%. The WSJ Dollar Index XX:BUXX -0.05% , an alternate measure of dollar strength, moved down to 73.17 from 73.22.Treasurys ended May with the biggest gain since January, while U.S. stocks posted theirbiggest monthly gains since February.
Treasuries making a reversal
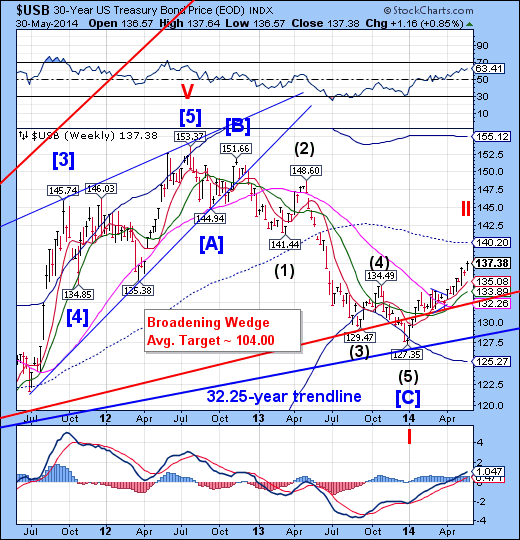
The Long bond extended its peak to Wednesday, May 28 in aCycle inversion.USB now has a date with a major Cycle bottom by the end of June.The rally may have beenbeen a bull trap for the unaware.
ZeroHedge: It seems shorts keep covering and the Chinese keep buying(through Belgium of course - as they sell CNY, buy USD, and grab the extra yield on Treasuries). Despite stocks relative stability, 10Y yields have just hit 2.40% for the first time in over 11 months (as USDJPY broke down). It seems this morning's dismal GDP print was just enough to confirm the growth/inflation slowing meme (in bond investors' minds) and the yield curve is flattening even further...
Gold folds
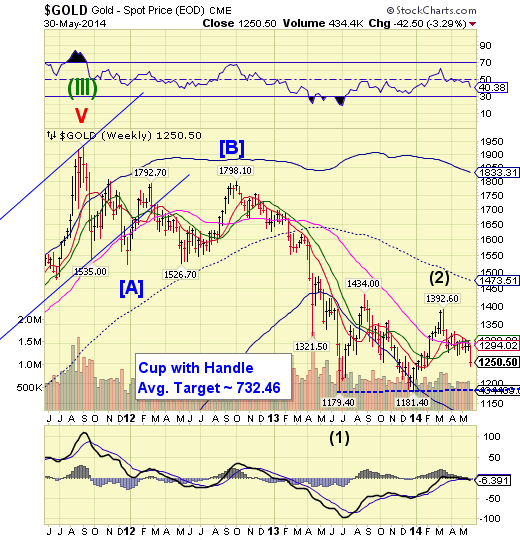
Goldcollapsed out of its sideways consolidation.The inability to close above resistance at 1300.00 on a weekly basiswas instructive. The sideways consolidation resulted in a continuation of the prior trend.
ZeroHedge: It would seem this week's technical breaks in the precious metals was the perfect testing ground for junior Barclays traders to wet their whistle with "sudden bursts of sell orders." Gold - once again - has seen a sudden heavy volume purge in futures ($1.7 billion notional worth in 5 minutes) that has pressed spot prices back under $1,250 and heading towards it worst week in 8 months...
Crude cannot overcome its prior highs
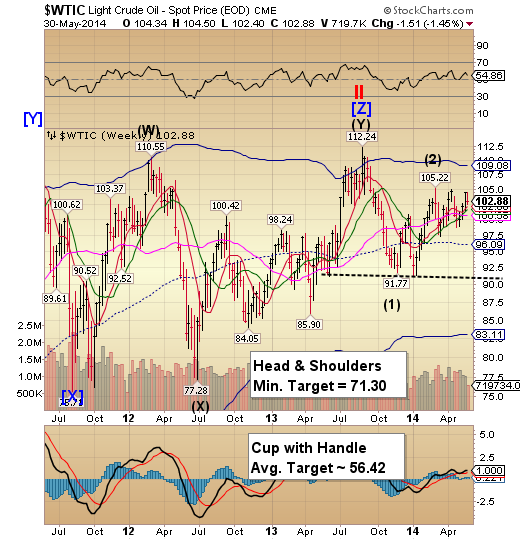
Crude backed away from its second attempt at overtaking its previous highs this week, without success.This may be indicative of a potential decline over the next several weeks.The reversal came on Tuesdayas suggested last week.
WSJ: Oil futures slid Wednesday on expectations that crude-oil supplies rose last week as imports rebounded from a 17-year low.
Light, sweet crude for July delivery settled down $1.39, or 1.3%, at $102.72 a barrel on the New York Mercantile Exchange. Brent crude on the ICE futures exchange fell 21 cents, or 0.2%, to $109.81 a barrel.
Analysts expect that U.S. oil supplies rose by 100,000 in the week ended May 23, according to a Wall Street Journal survey.
China also makes a third bounce off its neckline
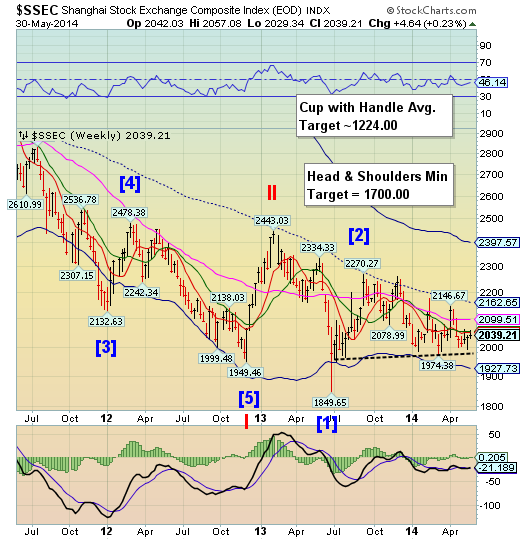
The Shanghai Indexchallenged Intermediate-term resistance at 2054.60, but failed to overcome it. It may now resume its descenttoward the neckline of its Head & Shoulders formation. This will now allow the Primary Cycleto continue by declining through the Head & Shoulders neckline. There is no support beneath its Cycle Bottom at 1927.73.
ZeroHedge: Recently we showed that in order to goose its fading all-important housing market (to China housing is like the stock market to the US: both mission-critical bubbles designed to give a sense of comfort and boost the "wealth effect"), China has first resorted to zero money down mortgages across various markets, and secondly to such gimmicks as "buy one floor, get one free." However, that's only part of the story. Even worse is what is not being disclosed to the general public: such as thetrue state of the housing market in China. Because according to a recent report on Sina, quoted on Investing In Chinese Stocks, when it comes to revealing just how bad things are domestically, Chinese developers are simply pulling a page out of biotech ETF playbooks, and simply not reporting price drops greater than 15%!
The Banking Index bounce stops at Intermediate-term resistance
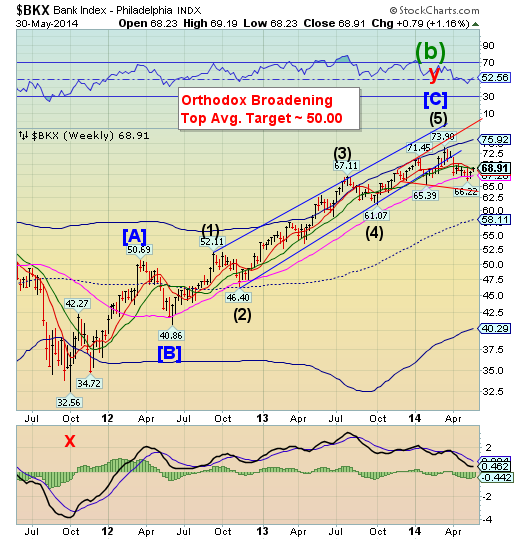
After challenging Long-term support at 67.24, BKXhas managed a weak bounce that could not overtake the higher Intermediate-term resistance at 69.19. A further decline from here may complete its Orthodox Broadening Top formation by breaking the bottom trendline. The next target is below its Orthodox Broadening formation near 62.50.
ZeroHedge: Earlier today, the world's oligarchs held a conference titled "Inclusive Capitalism" (where common peasants were not allowed to get closer than 300 feet) where inclusive supposedly means "trickle down in an era of record cronyness", which among others was attended by Bill Clinton, Prince Charles and Madame Kill Bill herself.
Here is what some of the participants said via Reuters:
Christine Lagarde, the managing director of the International Monetary Fund, said ... that progress in completing banking reforms was being hampered by fierce industry lobbying.
You mean the industry which was bailed out by the same oligarchs holding court today (courtesy of taxpayer funds), and which even the Fed admits is still Too Big To Fail, and thus has no worries that any of its negative behavior would ever have negative consequences. That industry?
ZeroHedge: A week ago, in retaliation to the inane charges lobbed by the US accusing 5 Chinese army officials of spying on US companies (when the NSA spying scandal on, well, everyone refuses to leave the front pages), China announced it would ban the use of Windows 8 on government computers (considering the quality of Windows 8, this is likely a decision government computers would have taken on their own regardless). Today, China has expanded its list of sanctioned companies from Microsoft to include IBM as well, following a Bloomberg report that the Chinese government is pushing domestic banks to "remove high-end servers made by International Business Machines Corp. and replace them with a local brand."
ZeroHedge: William Black's no-nonsense simplification of the fraud that we call a financial system is both addictive in its clarity and stunningly concerning in its scale. Having exposed Tim Geithner as perhaps the worst Treasury secretary ever, and that "banks have blood on their hands," the following brief discussion of 'how to rob a bank - from the inside' is crucial to comprehend that nothing has changed and to make matters worse, after 2009's 'reforms', "the weapon of choice remains accounting" as no one knows what it occurring behind the scenes of the banks...
Disclaimer: Nothing in this email should be construed as a personal recommendation to buy, hold or sell short any security. The Practical Investor, LLC (TPI) may provide a status report of certain indexes or their proxies using a proprietary model. At no time shall a reader be justified in inferring that personal investment advice is intended. Investing carries certain risks of losses and leveraged products and futures may be especially volatile. Information provided by TPI is expressed in good faith, but is not guaranteed. A perfect market service does not exist. Long-term success in the market demands recognition that error and uncertainty are a part of any effort to assess the probable outcome of any given investment. Please consult your financial advisor to explain all risks before making any investment decision. It is not possible to invest in any index.
