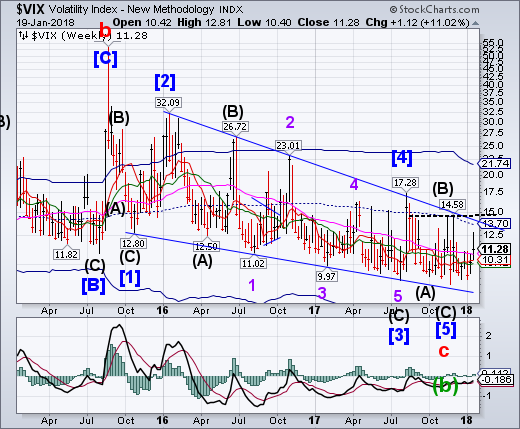
VIX ramped above Long-term support/resistance at 10.86, closing above it. This resulted in a a buy signal for the VIX. The calm may be broken. A breakout above the Ending Diagonal trendline suggests a complete retracement of the decline from January 2016, and possibly to August 2015.
(Bloomberg) Volatility was one of the never-ending talking points of 2017. Hardly a day went by without stories citing the almost eerie calm in U.S. stock markets. The Chicago Board Options Exchange Volatility Index, or VIX, finished the year with the lowest average daily level on record. During the course of the year, we saw the market’s fear gauge set a new record low when it closed at 9.14 on Nov. 3.
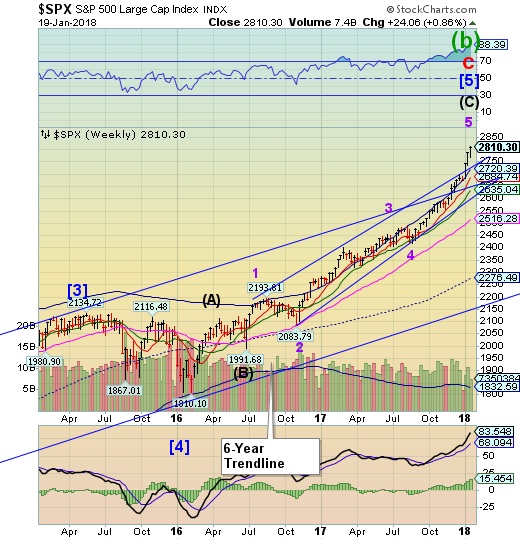
SPX goes parabolic.

SPX continues its parabolic rise above its Ending Diagonal channel in a throw-over formation. A decline beneath its Cycle Top and upper Diagonal trendline at 2720.39 suggests the rally is over and profits should be taken. A break of the Intermediate-term support at 2635.04 and the trendline nearby, generates a sell signal. Should that happen, we may see a sharp decline in the next two weeks.
(CNBC) Stocks closed higher on Friday as investors shrugged off worries about a possible government shutdown.
The S&P 500 rose 0.4 percent to close at 2,810.30, a record high, with consumer staples as the best-performing sector. The Nasdaq composite climbed 0.6 percent to finish at 7,336.38, also a record.
To read the entire report Please click on the pdf File Below:
