REVIEW
The market started the week at S&P 500 2425. After a rally to SPX 2432 on Monday, the market pulled back to 2413 on Tuesday before reversing in the afternoon. Wednesday’s gap up opening rally continued into Friday, when the SPX hit a new all-time high at 2464. For the week the SPX/DOW gained 1.20%, and the NDX/NAZ gained 2.90%.
Economic reports were mostly positive. On the downtick: the Q2 GDP estimate, retail sales, consumer sentiment, plus the budget deficit widened. On the uptick: consumer credit, business/wholesale inventories, the PPI, industrial production, capacity utilization, plus jobless claims declined. Next week’s reports will be highlighted by the NY/Philly FED and housing.
LONG TERM: uptrend
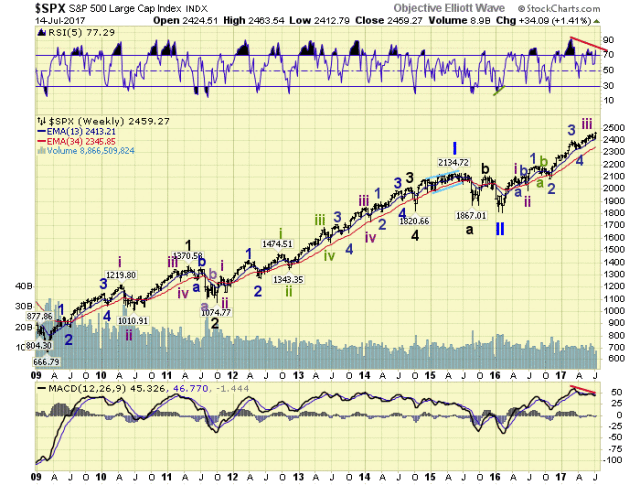
The Major wave 1, of Primary III, bull market continues. After a microscopic 2% correction in the SPX, 4% correction in the NAZ, and no correction in the DOW, the SPX/DOW made new all-time highs on Friday. We checked back to 1982, and could not find a SPX correction this small in a bull market. Quite unusual correctional activity lately.

The long-term count remains unchanged. A Primary II bear market low at SPX 1810 in February 2016. Then Major 1 of Primary III began. Intermediate waves i and ii completed in the spring of 2016. Minor waves 1 and 2, of Int. iii, completed in the fall of 2016. Minor waves 3 and 4 completed in the spring of 2017. Then Minor wave 5/ Int. iii, or a subdivision of Minor 5 completed in June. More on this below.
MEDIUM TERM: uptrend
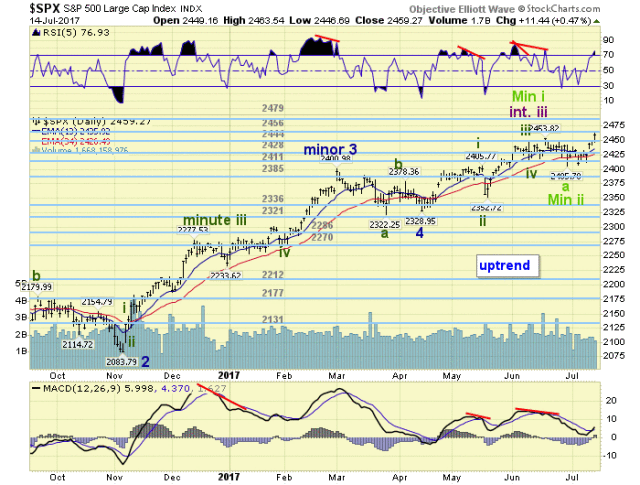
After the NDX/NAZ topped in early-June we waited for the 5th wave up in the SPX to complete. Which it did at SPX 2454. After that we were expecting at least a 5% correction, OEW 2321 pivot, as well as a correction in the NDX/NAZ/DOW. Last week the SPX/NDX/NAZ all confirmed downtrends, but the DOW oddly did not. Nevertheless the correction was unfolding with lower highs and mostly lower lows.
Early this week that all changed. After a rally to SPX 2432, which looked normal, the market failed to make a lower low for the second time: 2413, 2408 versus 2406. After the gap up opening on Wednesday it was clear that SPX 2406/2408 was a low of some importance. The market continued to move higher on Thursday, then made all-time highs on Friday. This activity suggests two possible scenarios.

The SPX 2406 low ended Minor wave A, and a Minor B is underway with a maximum of the OEW 2479 pivot range. Then a Minor C down would complete an irregular Int. wave iv. The second scenario is that Minor wave 5 is subdividing. Should the 2479 pivot range be exceeded then this is the likely scenario. This would suggest SPX 2454 was only Minute i, and the small correction to SPX 2408 Minute ii. Medium term support is at the 2456 and 2444 pivots, with resistance at the 2479 and 2525 pivots.
SHORT TERM
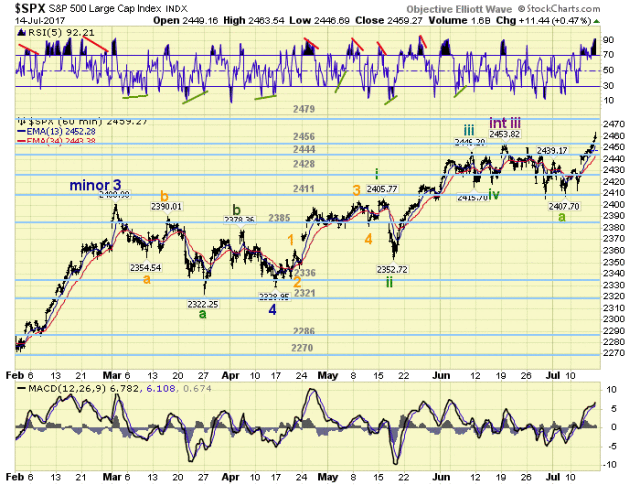
After the SPX 2454 uptrend high, the market declined in a series of overlapping waves to 2408 last week. After that the market has rallied in three waves up: 2432-2413-2464. With the third wave including a gap up. Thus far this looks impulsive, favoring the Minute iii scenario. A decline below SPX 2432 would turn it into a corrective move, and the correction would likely resume. Either way it is a bull market.

Short term support is at the 2456 and 2444 pivots, with resistance at the 2479 and 2525 pivots. Short term momentum ended the week extremely overbought.