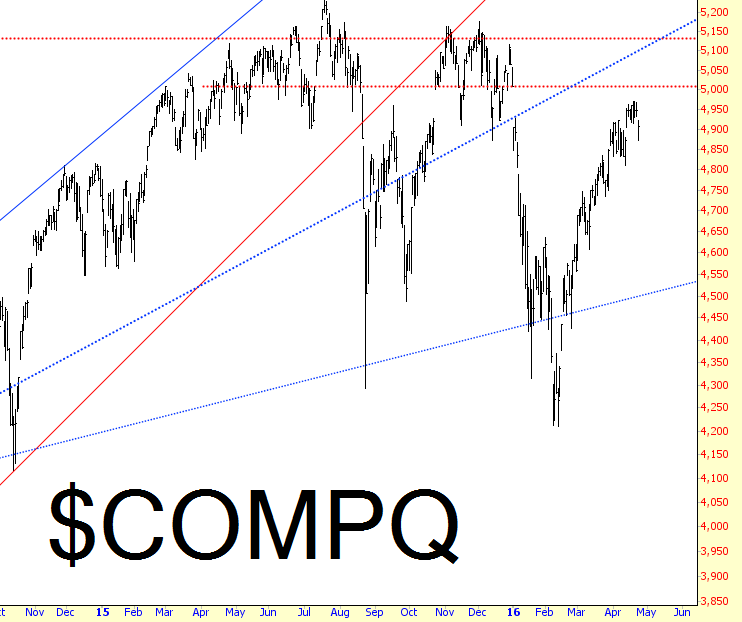
I’ve been watching the gap just above 5,000 on the NASDAQ Composite, and thanks to weak earnings from Microsoft (NASDAQ:MSFT) and Google (NASDAQ:GOOGL), we tumbled away nicely from that gap on Friday. I think it’s going to hold.
Asia’s bounce has sustained longer than I anticipated, but looking at the Chinese market by way of the fund shown below, it doesn’t exactly look like it’s poised for any sustained bullish run. It’s the same old story as seen on other charts (“lower lows, lower highs”); the question, of course, is when it’s finally going to roll over for another leg down.
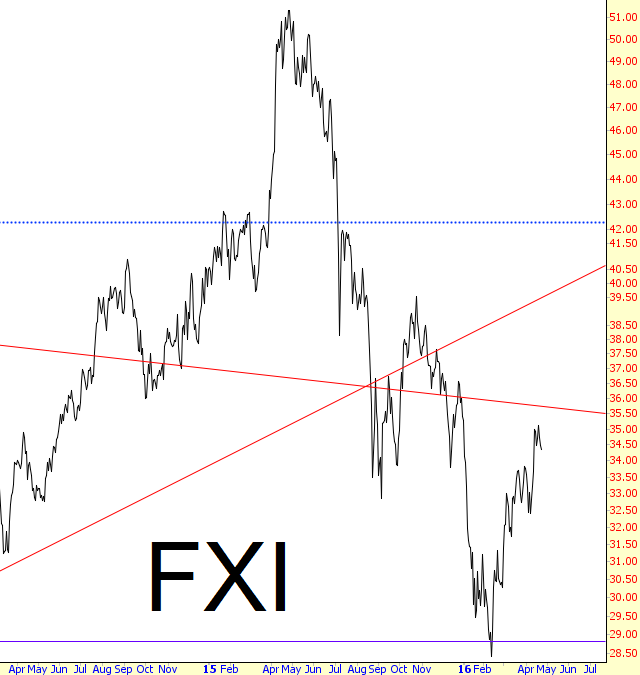
iShares China Large-Cap (NYSE:FXI)
One clue might be found in a favorite chart, the hedged Japanese equity/currency index. The head and shoulders is well-formed, but I’ve had to inch the neckline up a couple of times, particularly on Friday, when Kuroda hinted at something big coming up next Wednesday. This is still one hell of a good-looking pattern, though.
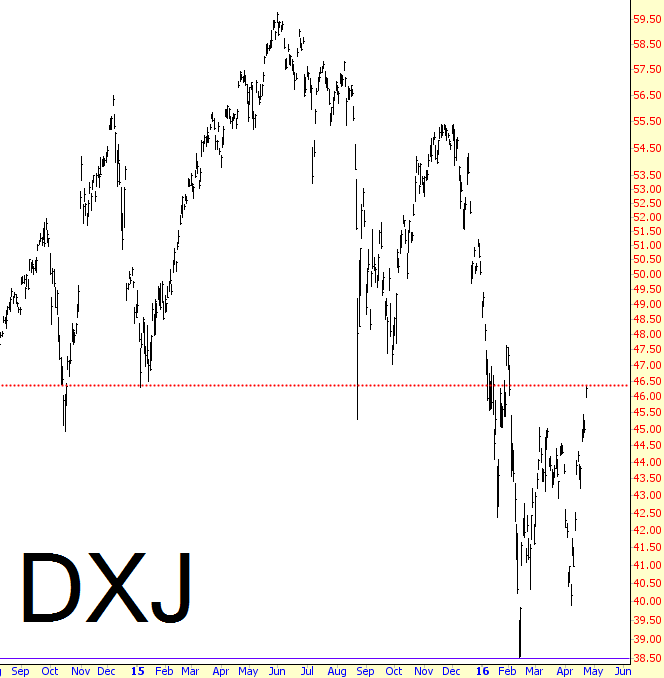
WisdomTree Japan Hedged Equity (NYSE:DXJ)
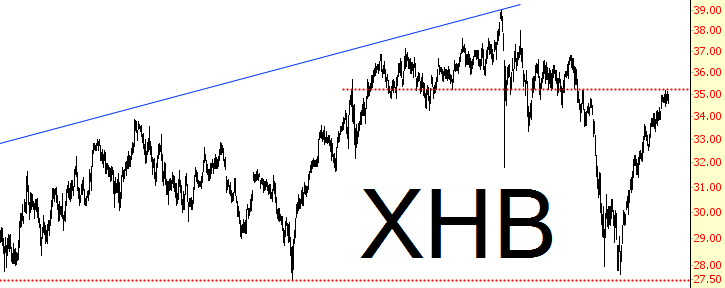
A not-as-wonderful but still pretty good short can be found on the homebuilders ETF (NYSE:XHB), shown below, whose red line-in-the-sand is at $35.20.
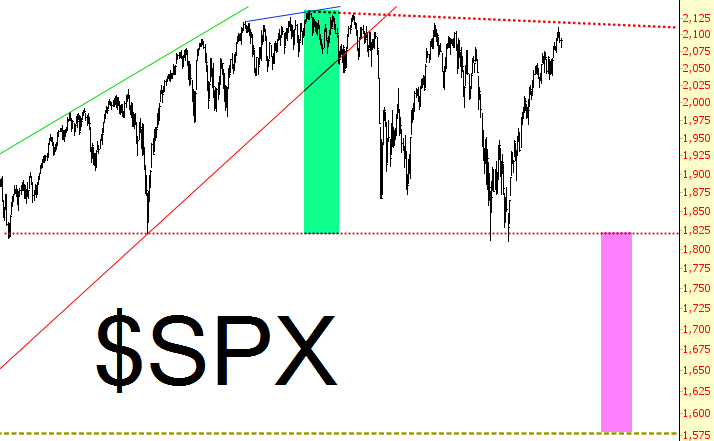
I had projected early in 2016 a low target of 1577. The last ten weeks has caused a big drop of confidence on my part that we’ll get there this year, since it seems almost like science fiction at this point. Maybe it won’t happen until next year. The measured move still makes sense (as long as this pattern isn’t broken to the upside, which is an increasing possibility). It would take something really big to make this happen. One possibility would be for Trump to get elected President, which of course would freak a lot of people out. That would be a “sea change” (which obviously the Powers That Be are trying desperately to avoid right now with a Clinton victory).
