This weekend I’ve gathered up 14 charts about the market in general and wanted to share a few words about each of them. I’ve spread these charts over four different posts, all of which will be available to everyone.
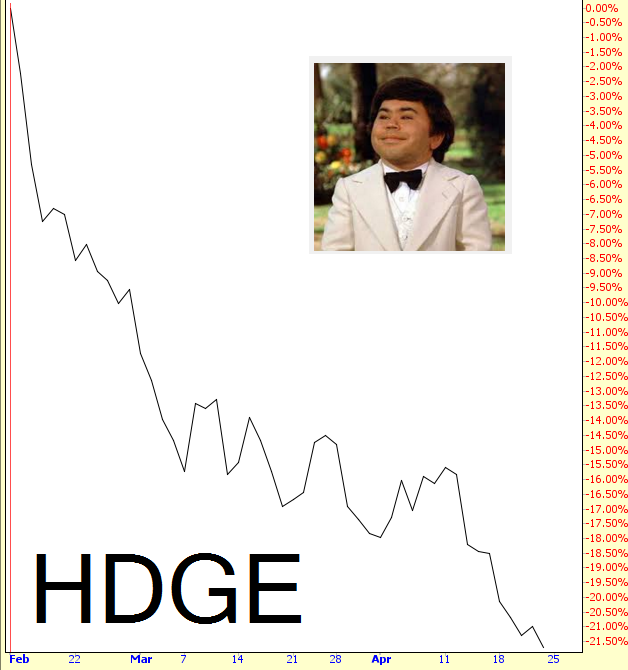
First off is a chart which expresses better than any other what a horrendous slog it has been for any surviving equity bears since the February 11th bottom. This is the fund with symbol Ranger Equity Bear (NYSE:HDGE) which specializes in shorting stocks. It has a great start to the year, but after February 11th, it’s been a quadruple-diamond ski slope downward, with losses now approaching a quarter of its 2/11 value. There’s been pretty much no respite this entire time.

One interesting way to look at this is by way of the Dow Industrials. In spite of this recent surge, the Dow is still about 400 points than it was last May. It has, for well over three years now, been swinging wildly within about a three thousand point range.
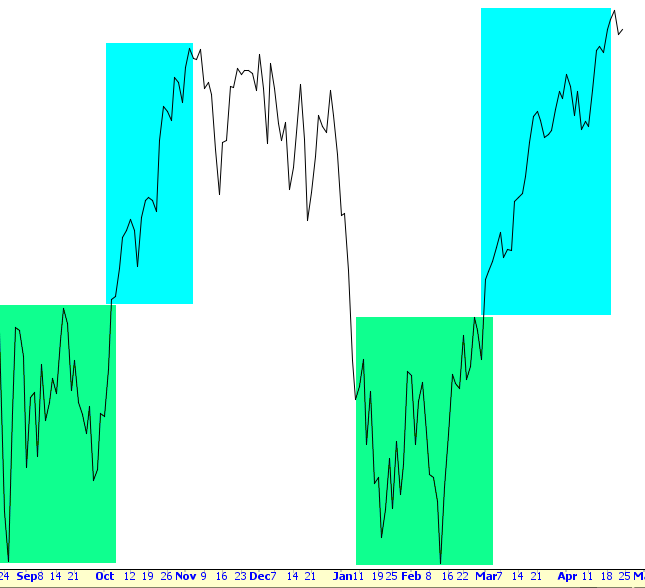
There’s an interesting analog to this: last autumn, you can see the Dow consolidating, as if revving up for a big assault (in green). Once it breaks free, it began a very rapid rise (tinted in cyan). It then rolled over, losing all those gains. It has, this year, repeated the same thing: building a base early in the year, and by late February, it roared higher. Of course, whether or not it “rolls over” again is anyone’s guess, but I find the parallel to be interesting.

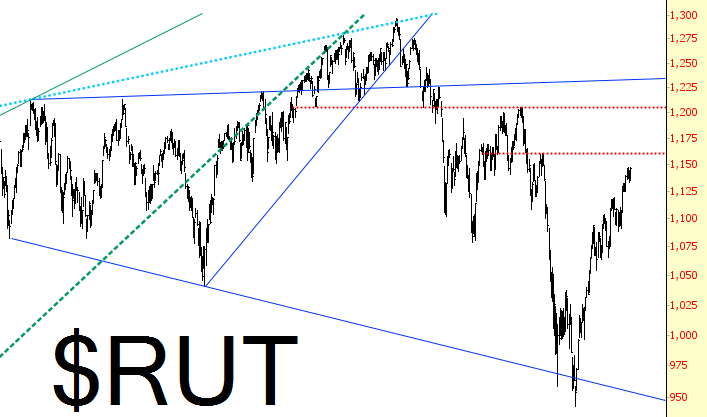
Perhaps the most intriguing index of all remains the small caps, which is far beneath its lifetime high (unlike some indexes, mostly in the Dow, which are quite near theirs). The next key test is that red line you see drawn at 1161. If it can stay beneath that, we at least will retain our series of lower highs.

I’ll have more for you later, so check back in!
