Let’s take a look this weekend at some of the major ETFs and what they might be suggesting for the weeks ahead. I’m doing these in alphabetical order.
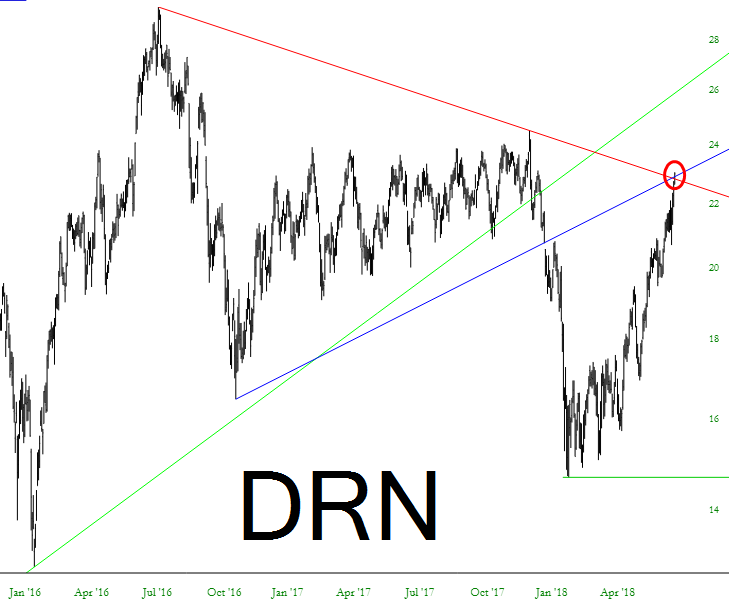
We begin with the triple-bullish-on-real-estate fund Direxion Daily Real Estate Bull 3X Shares (NYSE:DRN), which has been on a tear for months. (Its less volatile brother, iShares US Real Estate (NYSE:IYR), has been acting the same). This is kind of a fascinating chart, because it is precisely at the apex of its symmetric triangle. Of course, that doesn’t mean it tumbles into oblivion on Monday’s opening bell, but I would at least like you to note this “juncture”:
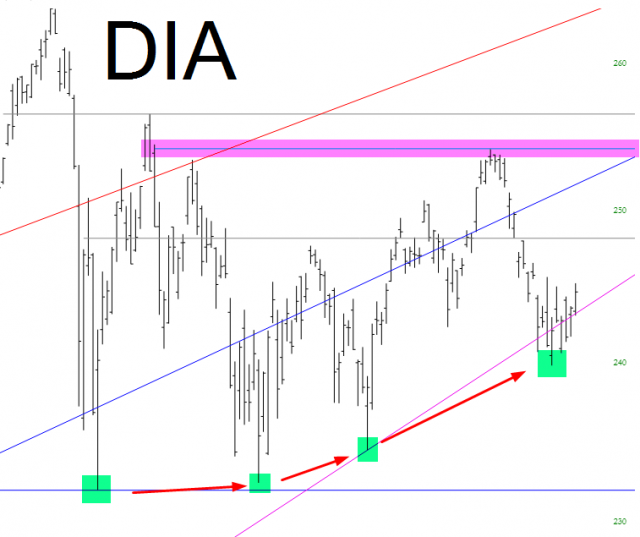
The Dow 30 got hit hard in the first few days of February, and it has been recovering in fits and starts ever since. This is generally a very bullish looking picture (yes, I am actually typing those words), because of the higher lows we’ve been seen (see green tints). A breakout above the magenta level would seal the deal and launch even the crusty old INDU (DIA) to new lifetime highs.
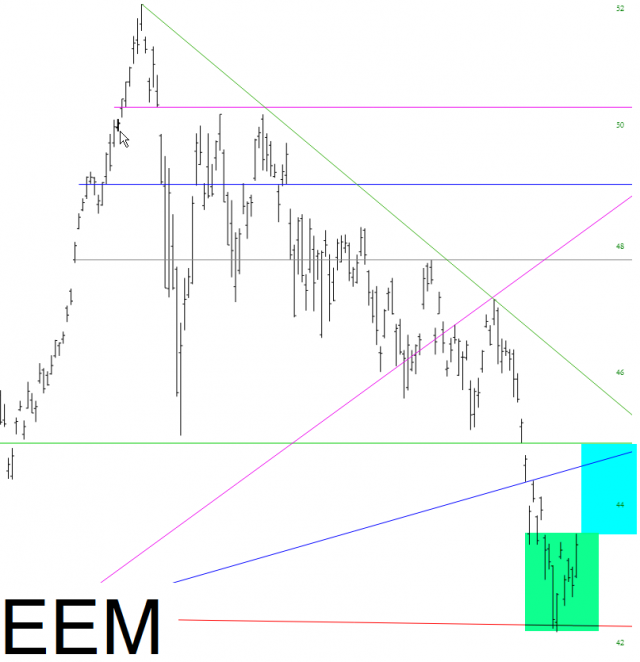
Emerging Markets (NYSE:EEM) have had it much worse than the United States equities this year. The “easy” recovery is about halfway done.
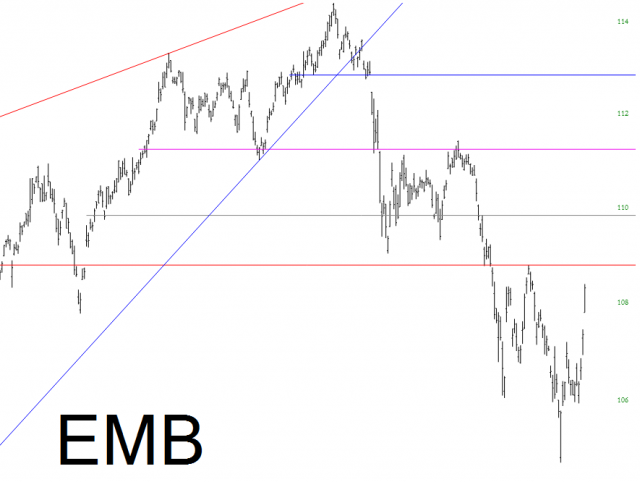
In a similar vein, an old favorite of mine, the Emerging Markets Bond Fund (EMB), has been swiftly undoing its damage, but it won’t be long before it hits a lead wall of overhead supply. This becomes a very enticing short setup at the red line.
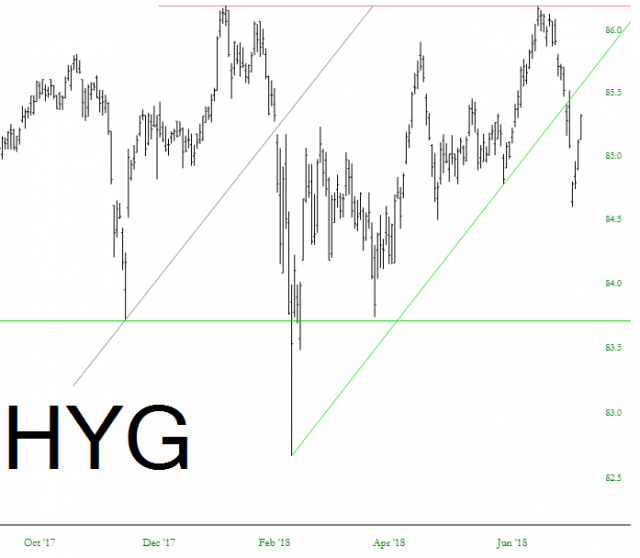
Closely related to this is the High Yield Corporate Bond Fund (HYG), which likewise will present an attractive risk/reward ratio when it finally reaches the underside of that now-broken green trend line.
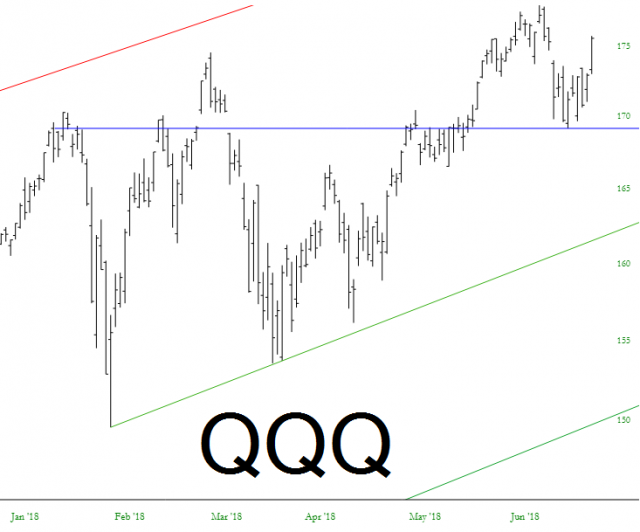
Of course, the NASDAQ (QQQ)has had it much easier in 2018 than the Dow. Although not presently at lifetime highs, just one more session similar to Friday’s would do the trick. As long as it stays above that blue horizontal, it is bullishly-configured.
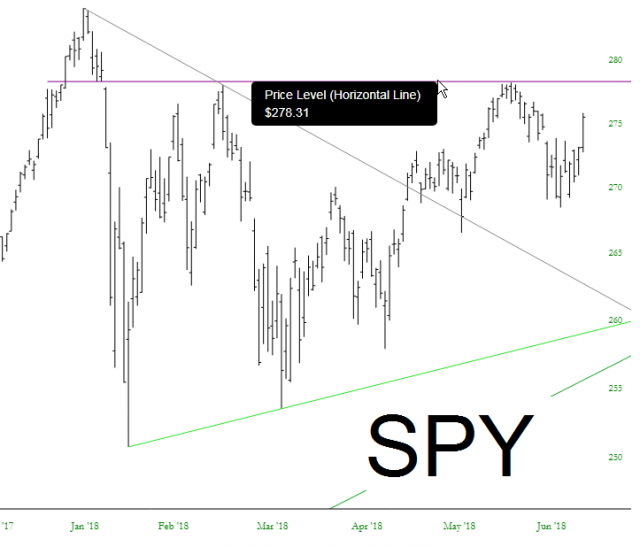
The SPY is kind of between the DIA (relatively weak) and the QQQ (relatively strong) markets. The horizontal shown, even though it is not a lifetime high, represents the next technically-important crossing point for this S&P 500 proxy.
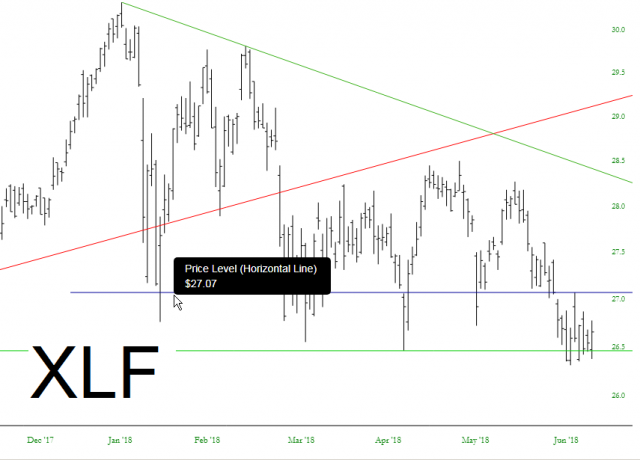
One of the few sectors that has remained relatively intact for the prospect of lower prices is the financials (XLF). It is range-bound at the moment, but as long as it doesn’t push above that blue horizontal, this is still a good triangle setup for a fall.
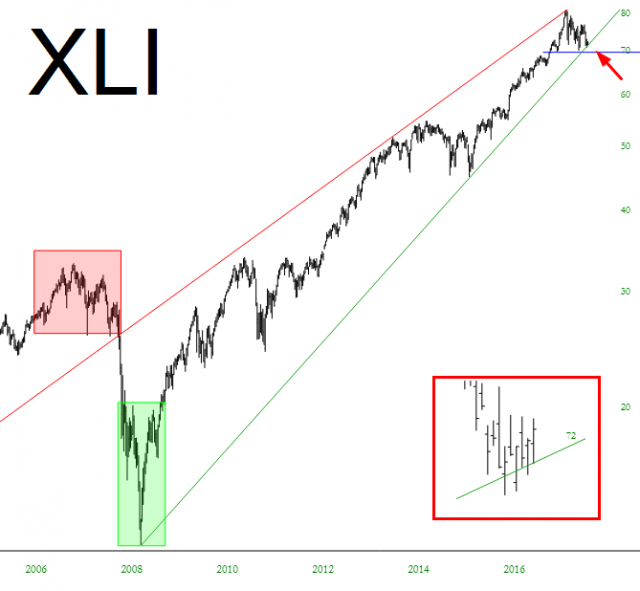
Lastly, the (XLI) shows nicely the “mixed signals” the market is giving. On the one hand, the very broad long-term bullish uptrend is steadfastly intact. On the other, as the inset illustrates, that has been some recent damage to this pattern. It isn’t a break, but it’s worth noting.
