by Pinchas Cohen
The Week That Was
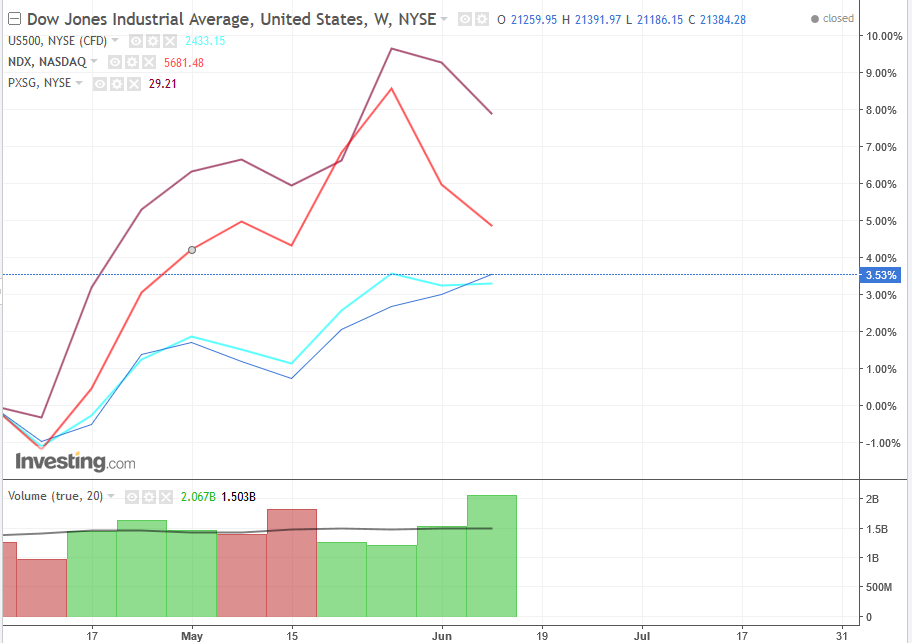
US indices closed at mixed levels at the end of last week with the Dow up, the S&P 500 eking in a 0.1 percent increase and the NASDAQ down 0.9 percent after last week's fall in tech sector. The small cap Russell 2000 declined one percent.
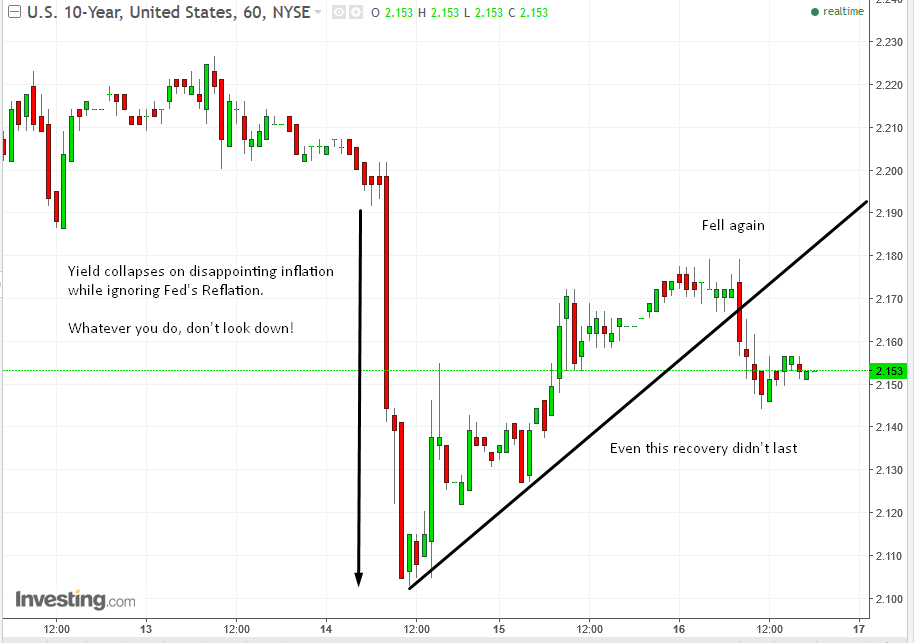
Investors were reacting to Wednesday's widely expected but disappointing inflation release, ignoring the seemingly optimistic interest rate hike, the third since the Trump reflation, as well as the Fed's plan to tackle its $4-trillion balance sheet. The 10-year Treasury yield—already at a historic low—fell again to 2.15%.
The surprising, but disappointing core inflation data was outdone by the surprise of Fed Chairwoman Janet Yellen and the Fed’s lack of deterrence by it. As of now the Fed is acting in a unexpectedly hawkish manner, in stark contrast to last year's dovishness when the momentum was heading in the opposite direction. While inflation was rising in 2016, the Fed wanted to wait until it achieved its 2 percent target to act, but now that it’s going the wrong way, it's convinced it will reach its target.
Given some of the weakness of the inflation data and also some of the slightly disappointing growth numbers, it seems that at this point the Fed should be done with their tightening cycle for 2017, although there remains a possibility of one more hike. Many investors remain unconvinced this will happen.
With regards to the Fed’s balance sheet, it announced a full-fledged, detailed plan to wind it down. It will be a very slow and predictable process, possibly taking up to five years if not more. Yellen described it as “watching paint dry.”
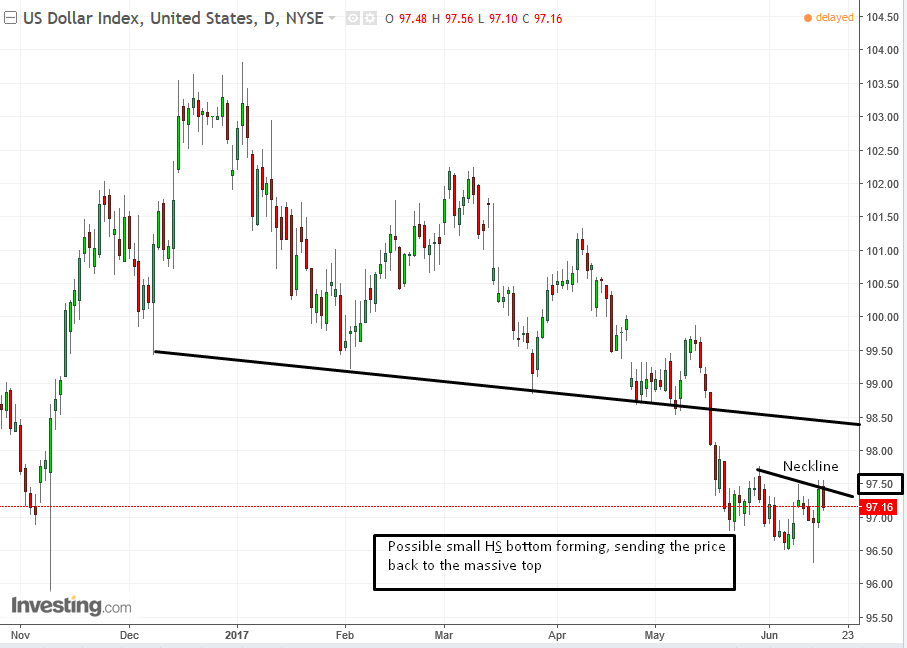
The dollar also had a volatile week and closed the week at a loss.
There has been some concern from investors that the Chinese economy is starting to decelerate again, but news from the last couple of weeks has been encouraging.
Two weeks ago, trade numbers were released which showed import demand from China had improved significantly across several different commodities, an important signal of economic strength, and last week better than expected domestic retail sales and industrial production activity data was released as well. These numbers are important for investors given the critical role that China plays as a growth engine for emerging markets' economies.
Over the last year or so there has been an improvement in the emerging market cycle, and that dynamic coupled with their cheaper valuations, has been an important source of upside this year. There still remains a concern among investors, of Chinese fraud when it comes to their economic projections and reporting.
Oil extended its fall with a 2.45% decline, slipping a total of 9.75% 4-week decline, on fears of a global oil glut and the continuation of the Gulf crisis.
Week Ahead
Tech, Fedspeak, Oil, Whole Foods
- Continued focus on the tech industry, after last week's sudden drop in value.
- The Fed's announcements may get more attention than usual, considering the Fed’s sudden hawkishness, as the economy slows down.
- US oil futures closed under $45, a key level; will it hold?
- Will fallout from Amazon’s bid for Whole Foods deepen?
Economic calendars may be working on a lighter schedule during the summer, but the Fed has a packed schedule of releases in the week ahead.
Investors are likely to continue to focus on the tech sector, which performed the worst on the S&P, down 1.1 percent for the week.
Amazon (NASDAQ:AMZN) made a $13.7 billion bid on Whole Foods, which rattled retail and food shares, in which they took out $40 billion from their market capitalization. Speculations are abound that another buyer will enter a bidding war, and investors entered a frenzy, pushing up the price of the stock 9.65 percent above the $42 offered by Amazon. Further price fluctuations can be expected in the week ahead.
Inflation and other data is not quite up to expectations, and investors are wondering if the Fed is overoptimistic on its estimates for housing starts, retail sales, consumer inflation and consumer sentiment.
After the recent disappointing data, existing home sales may prove important, as will Friday’s new home sales and manufacturing data. While investors will be ascertaining whether a pattern emerges, they would be equally interested whether a corresponding pattern emerges from the Fed’s half dozen speakers, starting with New York Fed President Willian Dudley on Monday, to continue its current apparent lack of concern.
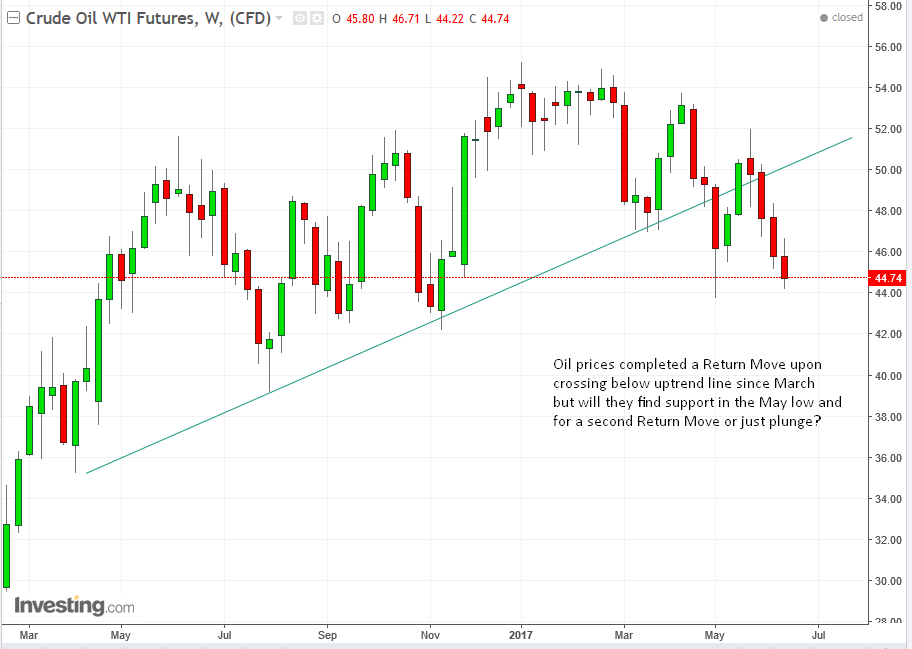
The price of oil proved a significant factor in the tech selloff, as investors rotated out of tech and into value stocks, including energy. Traders are betting whether the price will hold in the $45 per barrel level, it closed last week at $44.74 per barrel—a decline of 2.4 percent, or if it will fall even lower towards the $40 price level, which is considered negative to stocks.
The global market structure may recalibrate, undergoing a shift next week, when MSCI will decide whether to include a group of China’s mainland shares within its indexes. This would have a crucial effect on some large ETFs, such as the MSCI Emerging Markets. It would be good news, as it would give investors easier access to invest in Chinese markets, increasing the liquidity for the shares.
Monday
8:00 a.m. New York Fed President William Dudley
7:00 p.m. Chicago Fed President Charles Evans
Tuesday
Earnings To Watch: Lennar (NYSE:LEN), Adobe (NASDAQ:ADBE), FedEx (NYSE:FDX)
8:30 a.m. US Current account for Q1 is to be released.
3:00 p.m. Dallas Fed President Robert Kaplan is scheduled to speak.
Wednesday
Earnings To Watch:Oracle (NYSE:ORCL), Winnebago (NYSE:WGO), CarMax (NYSE:KMX)
10:00 a.m. Existing home sales is expected to fall for the month of May from 5.57M to 5.55M, but in the same time it's rising on a MoM basis from a negative 2.3 percent to a negative 0.7 percent.
Thursday
8:30 a.m. Initial jobless claims- The data is expected to show a rise from 237K to 240K
9:00 a.m. FHFA home prices will be published, highlighting the current health of US housing.
10:00 a.m. Fed Gov. Jay Powell will speak at the Senate Banking Commission.
Earnings To Watch
Bed Bath & Beyond (NASDAQ:BBBY): if you bought shares one year ago, you are down 15.25%. That’s a 35.17 percent loss relative to the S&P 500 19.92 percent return. Is this a good time to buy more?
Negative Fundamental Factors
- It’s EPS growth rate is a negative 3.63%, way below the 62.65% average of the industry. Not a good sign.
- Its free cash flow has been lower than its competitors, which means it won’t be able to pay down debt, buy back stock, pay out more in dividends or reinvest the money into the business.
Positive Fundamental Factors
- A better value of Price-to-Earnings ratio of 8.03 than the industry’s 18.26
- It has a lower debt-to-equity ratio of 54.85% than the specialty retail industry average of 73.69%.
- It enjoys a higher profit margin of 7.6% compared to its competitors who average out at 6.11%.
- A higher Return on Equity ( the amount of net income returned to its shareholders) of 25.69%, higher than industry average of 19.03%.
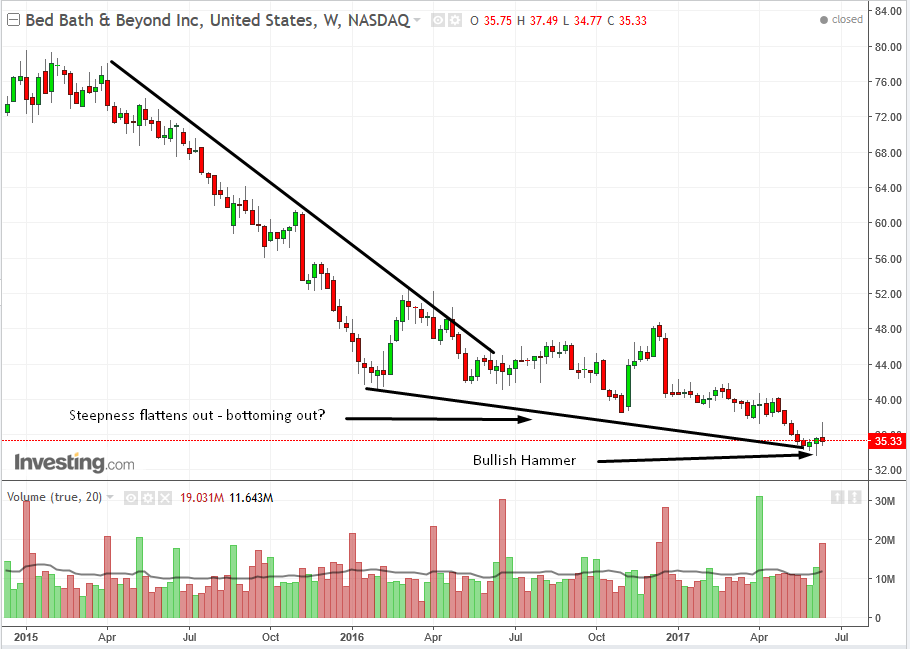
With 4 out of 6 positive categories, it’s probably not the time to unload your holdings, but if you’re not invested in them yet, you could probably find better bargains.
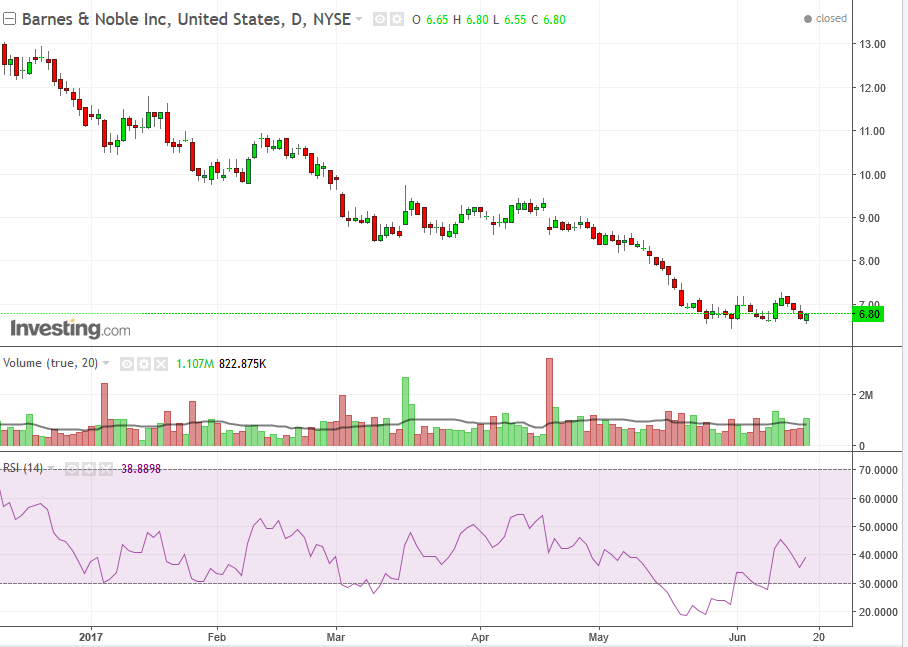
Barnes & Noble (NYSE:BKS): Analysts forecast earnings per share of $-0.17, up $0.07 or 29.17 % from 2014’s $-0.24 EPS. After posting $0.96 EPS for the previous quarter, Barnes & Noble’s analysts now forecast a -117.71% negative EPS growth. The company has declined 38.50% since June 15, 2016, and is continuing to slide. It has underperformed by 55.20% the S&P 500.
Technically, the stock has finished its down-trend line, with a bullish hammer, and has been trading sideways since May 24. Its RSI has been the most oversold this year and has been continuing to climb to higher levels.
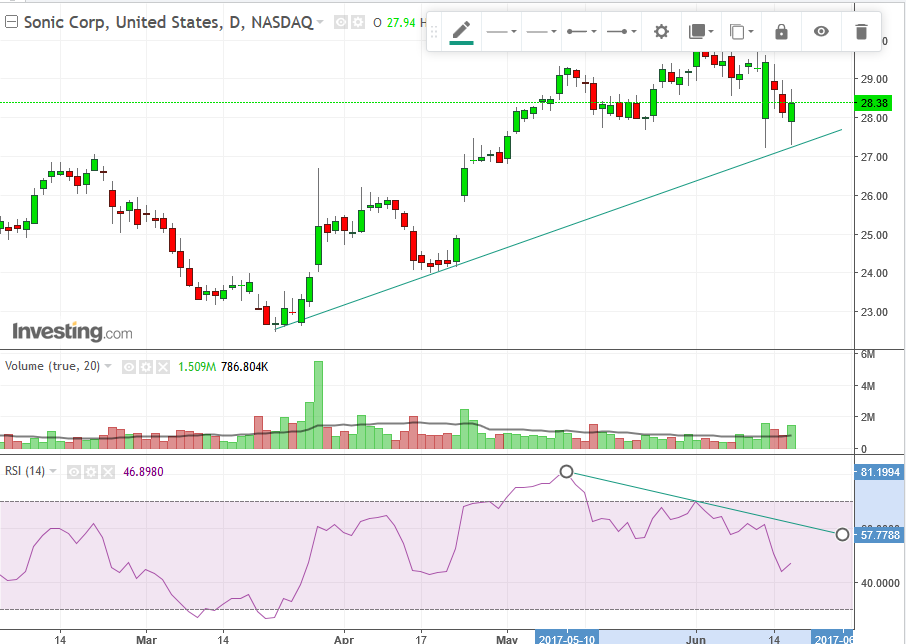
Sonic (NASDAQ:SONC) Zack’s Investment Research forecasts a consensus EPS of $0.41, a 0.95 percent YoY increase from $0.43.
Technically, while Sonic returned to its uptrend line, which would suggest a good buying dip, consider its RSI negative divergence.
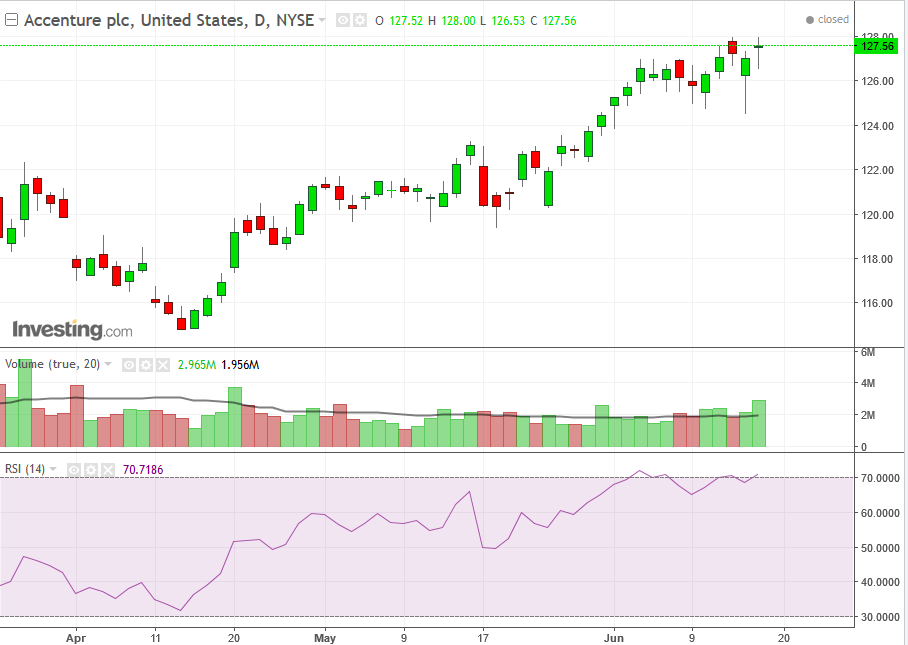
According to Zacks, Wall Street analysts forecast that Accenture (NYSE:ACN) will announce earnings of $1.51 per share for the current quarter. The highest EPS estimate is $1.56 and the lowest is $1.44. Accenture reported earnings of $1.41 per share during the same quarter last year, which indicates a positive year-over-year growth rate of 7.1%. The firm is scheduled to report its next quarterly earnings results on Thursday, June 22nd.
On average, analysts expect that Accenture will report full year earnings of $5.86 per share for the current year, with EPS estimates ranging from $5.82 to $5.92. For the next financial year, analysts expect that the business will post earnings of $6.39 per share, with EPS estimates ranging from $6.25 to $6.47. Zacks Investment Research’s EPS calculations are a mean average based on a survey of research firms who research Accenture.
While it is still above its uptrend line since April, and overcame its March peak of $126.53 with a close of $127.56, the close is still below Wednesday’s peak. Also, the RSI is showing signs of a struggle and may fall back into a sell signal after having been overbought.
Friday
9:45 a.m. Manufacturing PMI is expected to increase from 52.7 to 53 for the month of June.
10:00 a.m. New home sales are expected to have increased from 569K to 600K
10:15 a.m. St. Louis Fed President James Bullard
12:40 p.m. Cleveland Fed President Loretta Mester
2:15 p.m. Fed Gov. Powell
Earnings To Watch
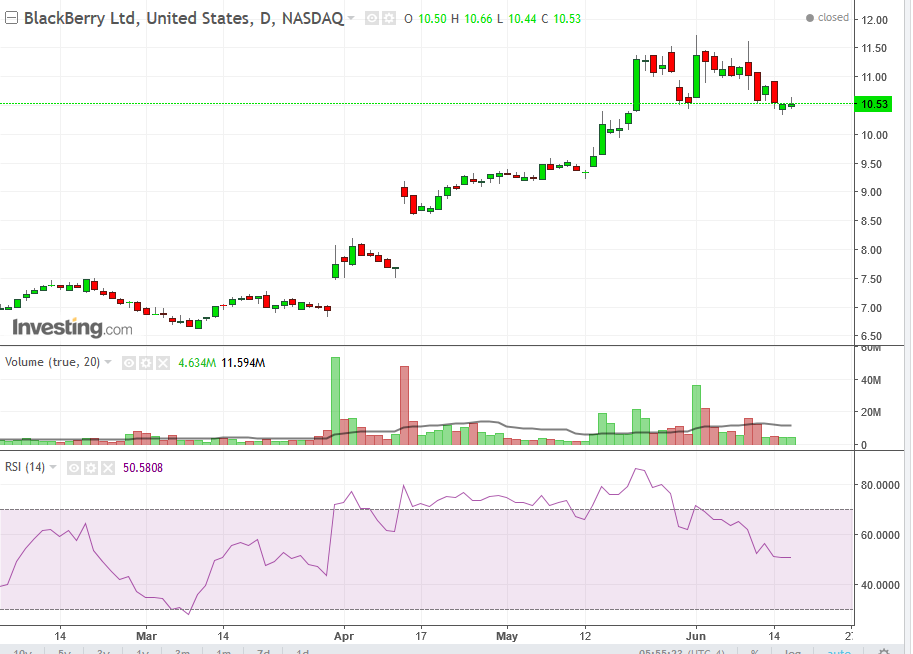
Earnings: Blackberry’s consensus estimate is that it will have a revenue of $265 million and an adjusted EPS of $0.00
Technically, the uptrend line is showing signs of weakness and the leading RSI indicator has already broken down.
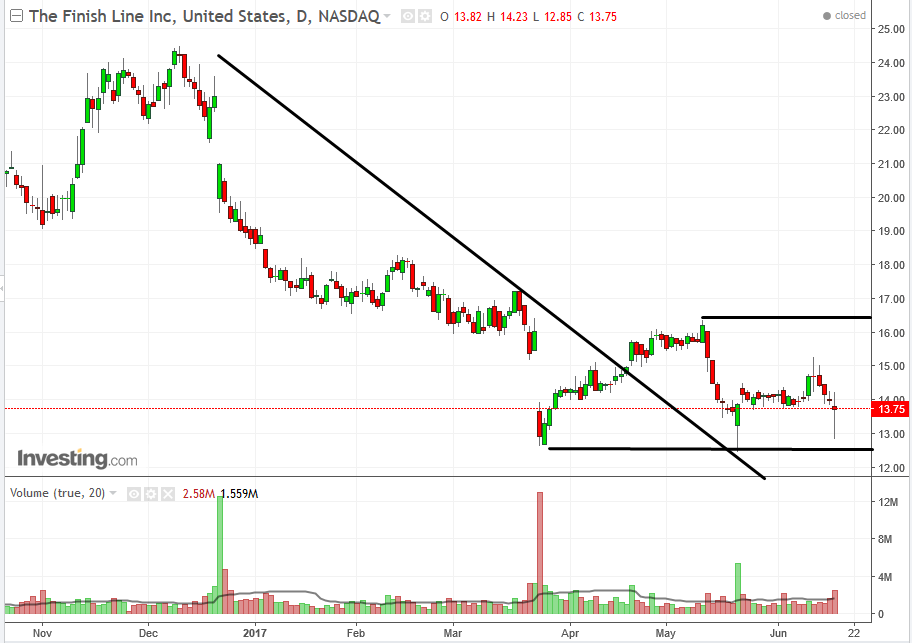
Finish Line Inc: Analysts expect $0.23 earnings per share, 0.00 % or $0.00 from last year’s $0.23 per share. It has underperformed by 36.39% the S&P 500.
Technically, the stock has declined 19.69% since June 16, 2016 and is has been trendless since it failed to make new lows since April, setting up the potential for a triple bottom reversal, which will be complete once breaking the neckline of its May peak of $16.38.
