• Oil sector ETF and the commodity itself diverge over demand outlook
• 10-year yields close at lowest since October 2016; remain inverted vs 3-month notes
With the White House continuing to provide mixed signals about the path to a resolution of the roiling U.S.-China trade war, investors should expect another volatile week for markets.
If markets determine this back-and-forth on trade is part of a coherent negotiation strategy from the 'negotiator-in-chief,' U.S. President Donald Trump, traders might be patient. However, if investors conclude that all those tweets and about-faces are the awkward meandering in lieu of a real plan, markets may be in for a rude awakening as yields plunge to multi-year lows and the yield curve remains inverted. Indeed, as a rule, the bond market usually gets it right.
Aggressive Trade War Rhetoric Halts Equity Rally
On Friday, U.S. equities dropped after Trump warned that next month's trade negotiations with China might be cancelled. The return of aggressive trade war rhetoric ended an exhuberant recovery after Monday's plunge and kept all major indices lower for the week.
Stocks sold off, with the S&P 500 slumping as much as 1.3%. Nonetheless, investors bought into the dip after the White House was seen to back off from its threat that the U.S. wouldn’t do business with Huawei.
The S&P 500 Index declined 0.66%, with all sectors falling save for defensive Utilities and Healthcare, which rose 0.15% and 0.16% respectively. As the leaders in both ups and downs during the protracted trade dispute, Technology (-1.15%) and Communication Services (-1.12%) underperformed. Though WTI crude surged on Friday as equity investors seemed to take heart from the IEA's third demand downgrade in four months, the Energy sector shares slipped, -1.12%. Apparently, commodity investors think the oil slump is over.
For the week, the S&P 500 declined 0.44%, with sector activity mixed. Energy (-2.15%) underperformed, as the sector’s fortunes became tied into trade, particularly since OPEC and Russia put off a meeting about production cuts till after the Trump-Xi meeting on the G-20 sidelines, confirming how dependent the oil market is on smooth global trade. Real Estate (+1.8%) outperformed.
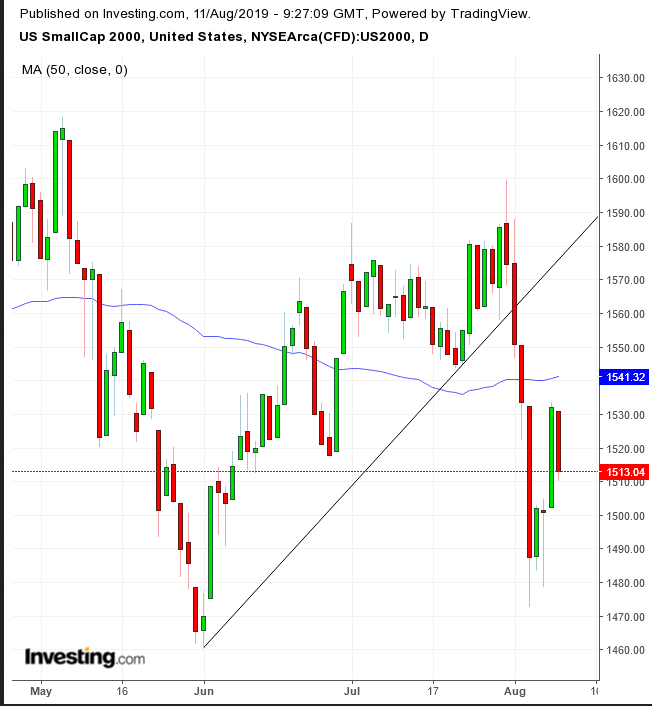
The Dow Jones fell 0.34% Friday and 0.75% for the week. The NASDAQ Composite tumbled a full 1.00% on Friday, dropping 0.56% for the week. The Russell 2000 underperformed both on a daily and weekly basis, sliding 1.25% on Friday and 1.33% for the week.
Technically, the recovery of three major U.S. benchmarks kept prices above the 50-week MA as well as above their uptrend lines.

The smallcap Russell 2000 has already failed both of these technical milestones, as of early May.
Despite the prevailing risk-off sentiment, 10-year yields climbed on Friday, though they were down for the week. Yields fell below 1.6 Wednesday for the first time since August 15, 2015 but already closed higher the same day.
Still, on Friday, yields closed at their lowest level—1.745—since October 2018. That's well below the 2.002 rate of the 3-month note, thus keeping the yield curve inverted. For months now we've pointed out the apparent contradiction between stocks and bonds. We've also mentioned repeatedly the long-term weakness in stocks even as bonds have been signaling risk-off.

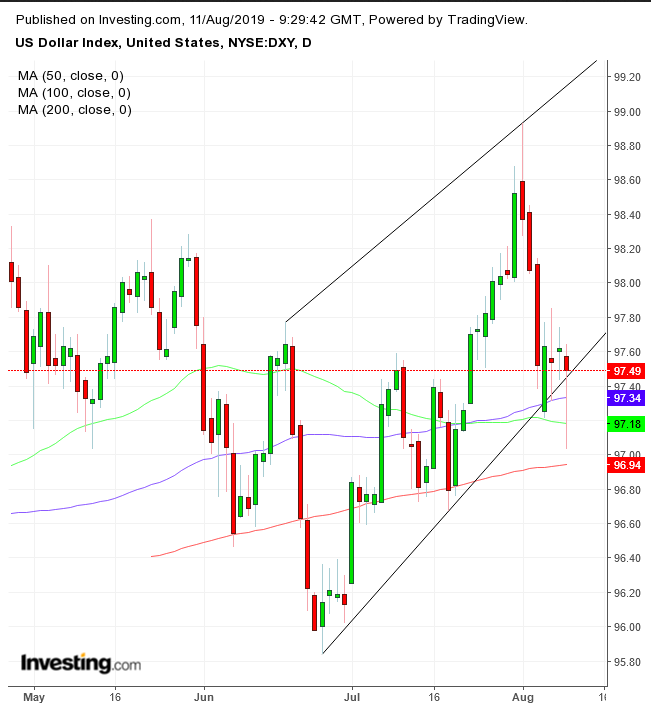
The U.S. dollar fell, -0.59%, the first time in four weeks. However, Friday’s trading—also down—confirmed the rising channel, producing a hammer after rebound, closing inside in the channel after retesting the 200-, 50- and 100-DMAs. If this trading pattern resumes, the dollar may retest the 99.00 level.

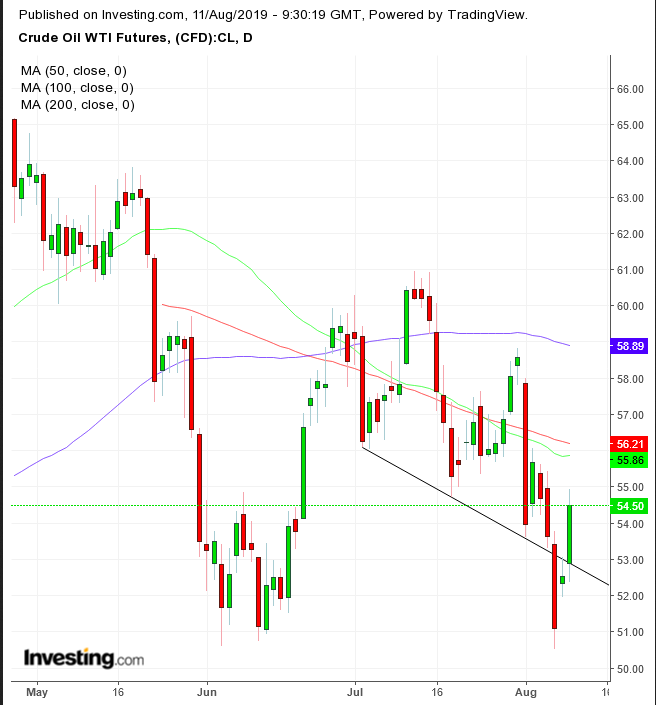
Oil soared 3.20% on Friday, its second consecutive daily jump which began Thursday, totaling 6.67%. However, the commodity was still down 2.08% for the week and 3.02% for the last two weeks, the result of a trade war that is threatening continued lower demand.
Technically, the price closed back above the neckline of a downward-sloping H&S top after finding support at the June lows. Should that have been breached it would have completed a descending channel, whose downside breakout would have completed a massive H&S top since 2016.
The Week Ahead
All prices listed are EDT
Tuesday
5:00: Germany – ZEW Economic Sentiment: expected to keep dropping to -27.8 from -24.5.
8:30: U.S. – Core CPI: seen to lower to 0.2% from 0.3% MoM.
22:00: China – Industrial Production: likely to fall to 6.0% from 6.3%.
Wednesday
2:00: Germany – GDP: probably dropped to -0.1% from 0.4%.
4:30: U.K. – CPI: forecast to edge down to 1.9% from 2.0% YoY.
10:30: U.S. – Crude Oil Inventories: seen to plunge to -2.845M from 2.385M.
21:30: Australia – Employment Change: expected to surge to 14.2K from 0.5K previous.
Thursday
4:30: U.K. – Retail Sales: forecast to decline to -0.3% from 1.0%.
8:30: U.S. – Core Retail Sales: expected to remain flat at 0.4%
8:30: U.S. – Philadelphia Fed Manufacturing Index: expected to plunge to 10.1 from 21.8.
Friday
8:30: U.S. – Building Permits: forecast to rise to 1.270M from 1.232M.
