- S&P 500, Russell 2000 suffer worst selloff since October
- Treasurys rise as yields fall to a three-month low
- Past virus outbreaks had no lasting impact, but after strong equity performance a correction is timely
Risk assets were hit hard at the close of last week's trade, as investors sold off equities on worries that the cornonavirus could spread and outbreaks of the illness might increase globally. Concurrently, safe havens rose.
Oil fell for a fourth straight day, along with yields, as Treasurys and the yen advanced for the same number of sessions. Gold’s move higher was checked by a strengthening dollar.
It’s important, however, to consider that at least some of the virus-motivated selloff—after such a strong stock market performance since the beginning of the year and with new headlines fanning the risk-off flames—is incentivizing greedy investors to hang on to as much of their “hard-earned” profit as possible. While previous viral outbreaks around the world have ultimately not made a significant dent in economic and market performance, considering the forcefulness of the recent rally, investors may be more concerned with keeping their winnings than garnering additional windfalls.
In other words, we can expect a deeper correction in what is still very much an uptrend.
Russell 2000 Underperforms On Domestic Health Worries
All four main U.S. indices—the Dow, S&P 500, NASDAQ and Russell 2000—plummeted on Friday. For the S&P and Russell 2000 it was the worst slump since October.
The tech-heavy NASDAQ lost the most since December. Among the major indices, the Russell 2000 underperformed, plunging 1.49%, the worst drop for the small cap index since Oct. 1, when the domestically benchmark shed 1.97% of its value.
Normally, geopolitical risks benefit domestic firms. However, after U.S. health officials confirmed two cases of coronavirus in the U.S. late last week, (three as of Sunday). Rising anxiety of a negative impact to the economy offset all other market considerations.
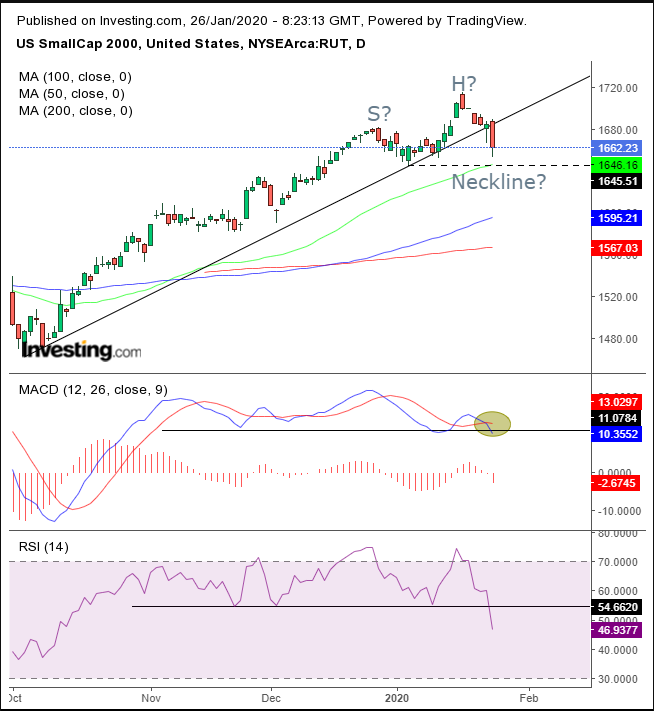
During Friday's trade, the Russell 2000 formed nearly a whole candle below its uptrend line since the October bottom. This may be the set-up for a H&S top.
Both the RSI and MACD provided bearish signals. The latter would gain more significance after falling below 10, the support level since November.
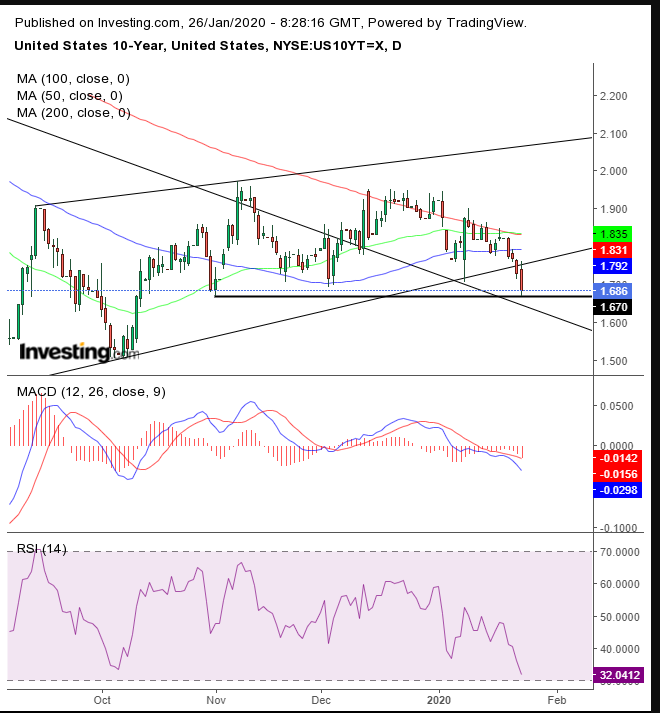
A rush to buy Treasurys pressured yields—including for the benchmark 10-year note—sending them lower for the fourth straight day. Yields hit a three-month low, below the rising channel since the Sept. 3 bottom, to test the support since Nov. 1, right above the broken downtrend line in place since November 2018, after failing to get past the 200 DMA, which guarded the Nov. 7 highs.
The dollar received a boost from the rush into Treasurys since it's the currency global investors need to buy them. This kept the USD within the short-term uptrend since the Dec. 31 bottom, breaking to the topside of the downtrend line since the Oct. 1 top.
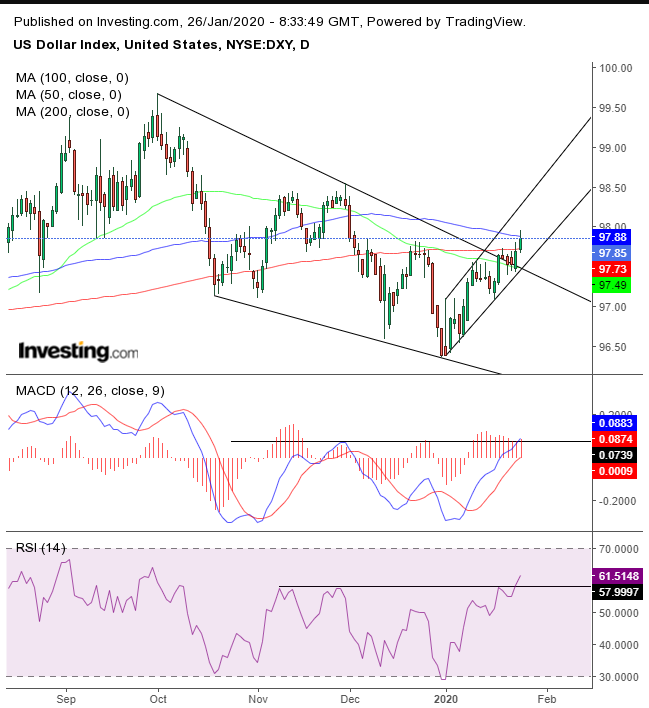
The dollar blew past the 200 DMA, a proven support-resistance level since November, pulling with it an RSI breakout and the MACD. It retested its resistance, the 100 DMA, which remains the last bastion of the falling channel since the October top.
Note, however, the trend has not reversed, and won't be until it can produce two rising peaks and troughs.
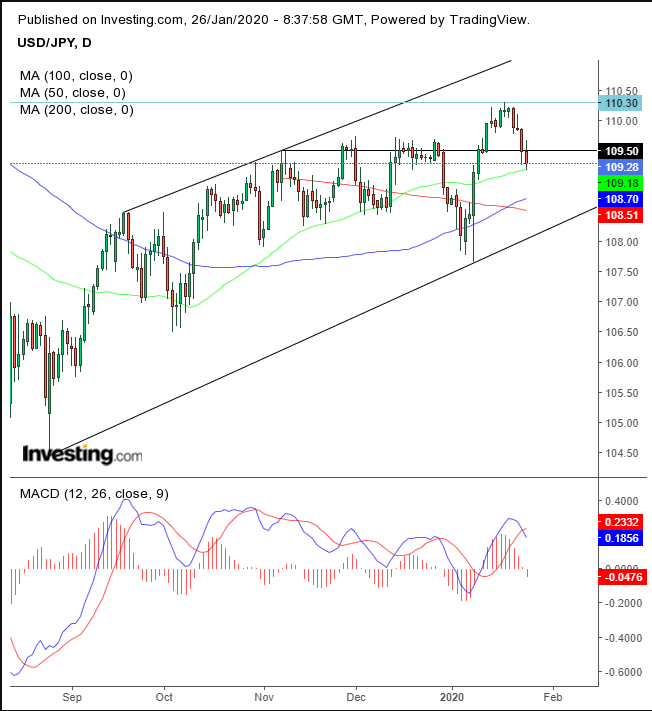
Despite the dollar strength amid rising global Treasury demand, the greenback fell against a strengthening yen, for the fourth straight day. It stopped below the November-December highs, but found support by the 50 DMA.
The MACD signals a continued declined for the USD/JPY pair, which would be a good opportunity for the pair to retest the rising trend line since the Aug. 26 bottom.
Gold pushed higher on Friday, but its rally in the past few days has been hampered by competition from Treasurys, which share the same denomination as gold, making the precious metal more expensive and therefore less competitive.
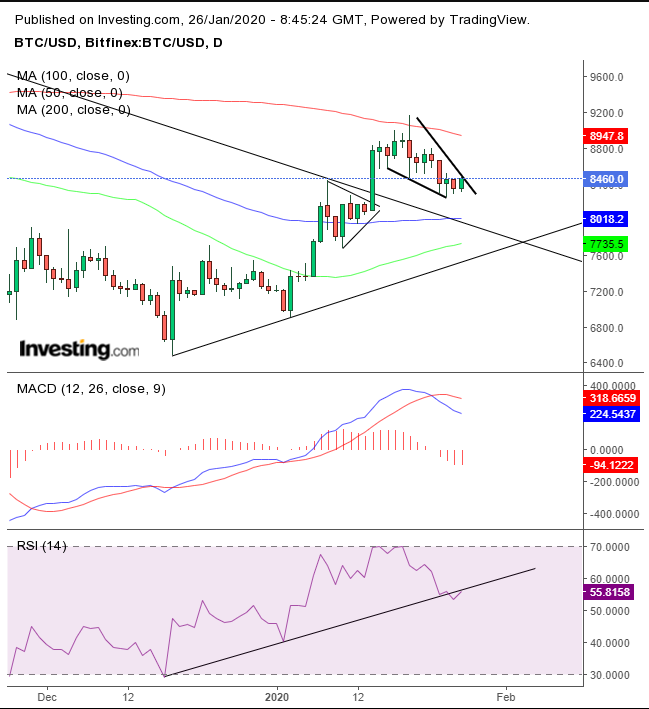
The same might be said about Bitcoin, which is also priced in dollars. Still, after being in the grip of the downtrend line since June, the cryptocurrency could be taking the opportunity of 200 DMA resistance to develop a falling flag.
Should that be the case, it would create a nice balance once it breaks through the downtrend line, after developing the pennant. Just keep an eye out for the MACD’s bearish cross, even as the RSI curled upward after dipping slightly below its uptrend line.
Oil's slide continued on Friday. The commodity lost the most in a year, as traders' pessimistic outlook, amid oversupply concerns, worsened considerably.
Technically, crude achieved the immediate target we described last week. However, WTI's most oversold RSI since June may be signaling the price is ripe for an upward correction to retest the flag, before it attempts to take on a more drastic target.
The Week Ahead
All times listed are EST
Monday
4:00: Germany – Ifo Business Climate Index: expected to rise to 97.0 from 96.3.
10:00: U.S.– New Home Sales: seen to advance to 730K from 719K.
Tuesday
8:30: U.S. – Core Durable Goods Orders: probably jumped to 0.2% from -0.1%.
10:00: U.S. – CB Consumer Confidence: anticipated to have climbed to 128.0 to 126.5.
19:30: Australia – CPI: expected to have eked higher, to 0.6% QoQ from 0.5% previously.
Wednesday
10:00: U.S. – Pending Home Sales: forecast to drop to 0.5% from 1.2%.
10:30: U.S. – Crude Oil Inventories: previously reading showed a drawdown, -0.450M.
14:00: U.S. – Fed Interest Rate Decision: expected to remain steady at 1.75%.
Thursday
3:55: Germany – Unemployment Change: expected to drop to 3K for the month of January from 8K in December.
7:00: UK – BoE Interest Rate Decision: expected to remain at 0.75%.
7:30: UK – BoE Governor Carney Speaks: This will be the last meeting he chairs.
8:30: U.S. – GDP: seen to remain flat, at 2.1% QoQ.
20:00: China – Manufacturing PMI: expected to teeter at the expansion cut-off line of 50.0, down from 50.2 in December.
Friday
5:00: Eurozone – CPI: seen to edge higher to 1.4% from 1.3%.
8:30: Canada – GDP: probably rose to 0.1% in November, from -0.1% in October.
