- Tech sector makes a comeback on worsening economic outlook
- Earnings releases could provide market boost in the week ahead
With the chances of political drama weighing on markets now less likely, after the peaceful transfer of power to newly inaugurated US President Joseph R. Biden, Wall Street wavered on Friday, turning in a mixed performance on the final day of last week's trade. US indices retreated from all-time highs on a bleaker COVID-19 outlook and the possibility the much-anticipated new stimulus is not necessarily a forgone conclusion.
However, according to the Wall St. Journal, "analysts said they believe the market has potential to keep climbing as long as earnings continue to show companies are weathering the coronavirus pandemic." And with earnings season now in full tilt, markets could continue higher this coming week with quarterly reports from Apple (NASDAQ:AAPL), Tesla (NASDAQ:TSLA) and Facebook (NASDAQ:FB) among others, upcoming.
Strongest Post-Inaugeral Performance By US Indices
The S&P 500 Index declined on Friday, for the first time in four days, after news surfaced that the coronavirus variant first seen in the UK is both more dangerous and more contagious. British Prime Minister Boris Johnson warned the strain is 30% deadlier than the original virus and also expected to be 50-70% more contagious. Nevertheless, two top US health officials cautioned that "more data was needed."
While the SPX fell 0.3% on Friday, it rose 1.9% for the week. What stood out over the course of last week's trade: stocks were boosted by technology firms, after they’d been underperforming amid previous rallies. Communication Services outperformed for the week, (+5.4%), followed by Technology shares (+4.25%).
Last week’s gains were built on the ongoing rally over the past nine months. All four major benchmarks—the Dow Jones, S&P 500, NASDAQ and Russell 2000—each carved out new highs over the course of the week, culminating in the strongest post-inaugural performance for the US market since 1932. The S&P 500 Index added 14% of value that day.
The second-best inauguration gains occurred when John F. Kenney took office January 1961, after his win against then-Vice President Richard Nixon in the 1960 election. The SPX gained a much lower 9% that day.
Though the past week's gains appear to be primarily the result of the installation of a new administration, it's actually the confluence of a few triggers: the Trump administration ushering in vaccines that revived hopes of a reopening economy even amid the coronavirus fatalities and hospitalizations: and, since the January Senate runoff in Georgia, the anticipation of further stimulus, something that seems more possible with a Democrat-controlled Congress.
Adding to that optimism: those two specific drivers are also among the new administration’s first priorities.
Still, there remains a lot of debate concerning the viability of a market that has been roaring ever higher, hitting record after record divorced from current economic realities. While we agree that valuations are high, recall that the situation was similar in 2005, yet it took the stock market three more years before it crashed.
We were bearish in 2015-16, but Trump's victory reawakened the market’s animal spirits. We were also bearish in February, but despite the March dip, that view didn’t ultimately pan out either.
The market, it appears, has been disconnected not only from the economy, but from market dynamics themselves. The one component introduced into the economy and the market since the 2008 crash has been quantitative easing, echoed since the start of COVID by financial aid checks in the mail. While they encourage spending, they also artificially inflate assets, as illustrated by the following S&P 500 chart.
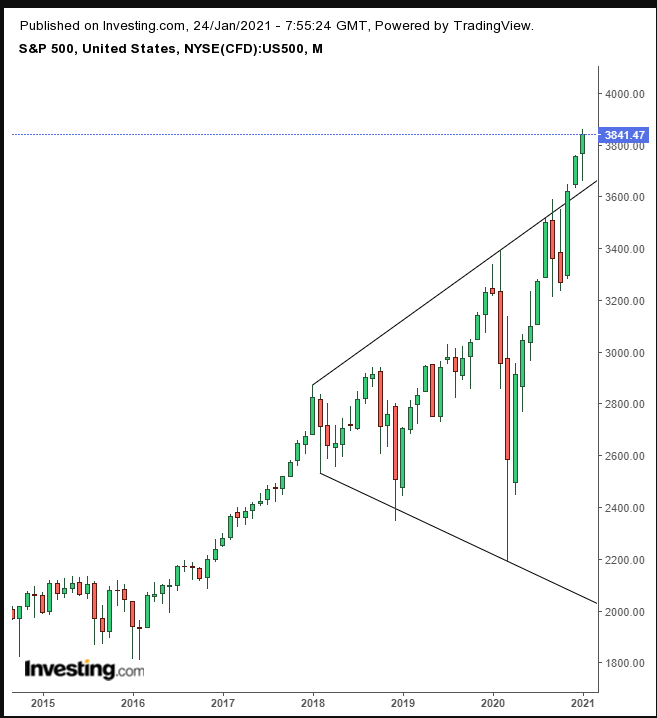
We cautioned about a possible crash in early 2020, and warned of one again in late 2020, but each time, the SPX reached the top of a massive Broadening patten in place since January 2018 and then moved higher. The upside breakout, however, now increases the odds of a continued rally, with the previous top serving as a floor.
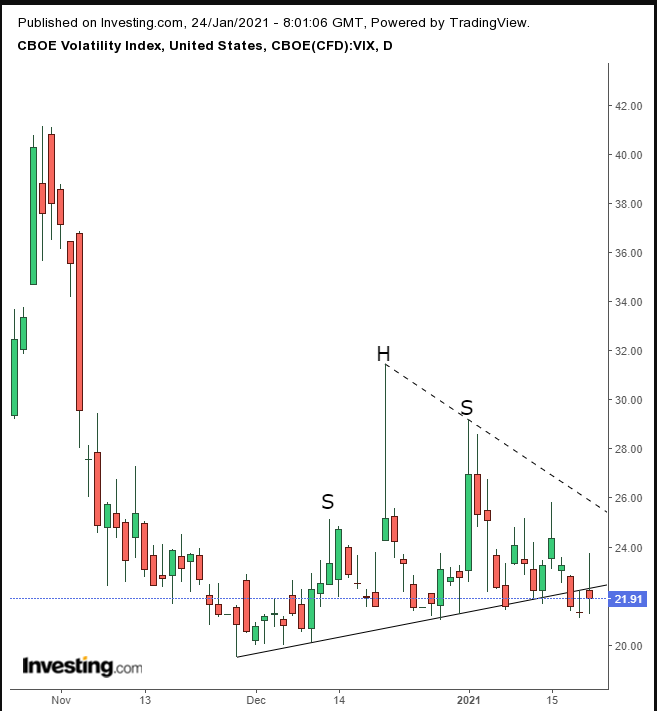
On Friday, the VIX fell below its uptrend line since Nov. 27, completing the equivalent of a H&S continuation pattern. On the other hand, on Friday it may have completed a Morning Star. The (dotted) downtrend line from the head may be the test of the stronger technical driver.
Yields, including for the 10-year Treasury note, also support a bullish view on stocks.
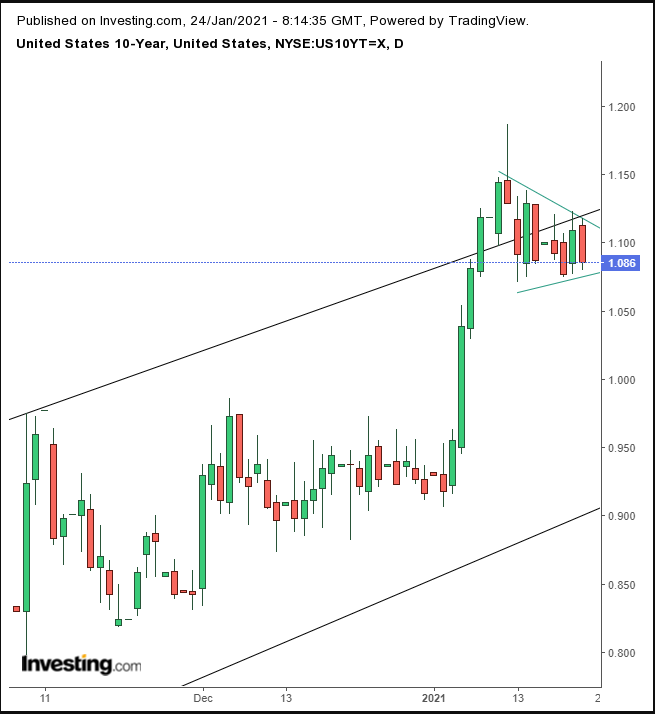
Rates formed a pennant, bullish after the sharp preceding advance, as investors sold off Treasuries. The fact that the pennant developed at the top of a rising channel increases the likelihood that its bullish view will complete with an upside breakout, as Treasury bears gear up to push yields beyond the confines of the current rising channel.
As the trading week came to a close, the dollar missed an opportunity to take on the downtrend line since the March top.
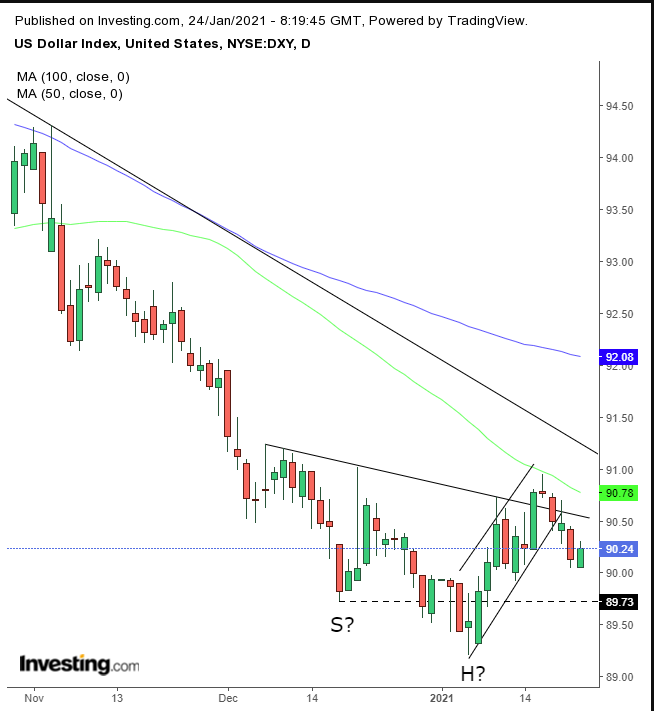
This occurred as the 50 DMA, which has been falling away from the 100 DMA since late-November, pushed it back below a downtrend line since December, as well as below its rising channel since the Jan. 6 low, when rioters stormed the Capitol. However, vigilance is warranted as the trend line since Dec. 7, to the Jan. 6 low may prove to be the midpoint of a H&S bottom, which of course can morph into a variation of a bottom.
The path for gold is unclear, as it shifts between its status as an inflation-hedge and a safe haven.
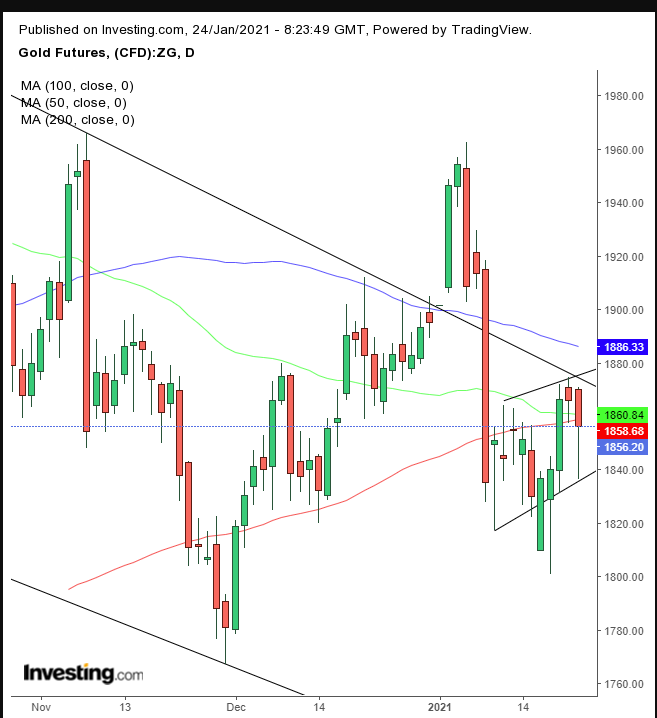
The yellow metal is trading within an imperfect rising flag—imperfect, because of a downside fakeout—which is bearish after the preceding drop which put it squarely back into its falling channel. Note, the 50 and 200 DMA are converging. This signals that this price level has the potential for an outburst.
Bitcoin suffered its first back-to-back weekly decline since September, but its trading pattern is making the argument for another rally ahead.
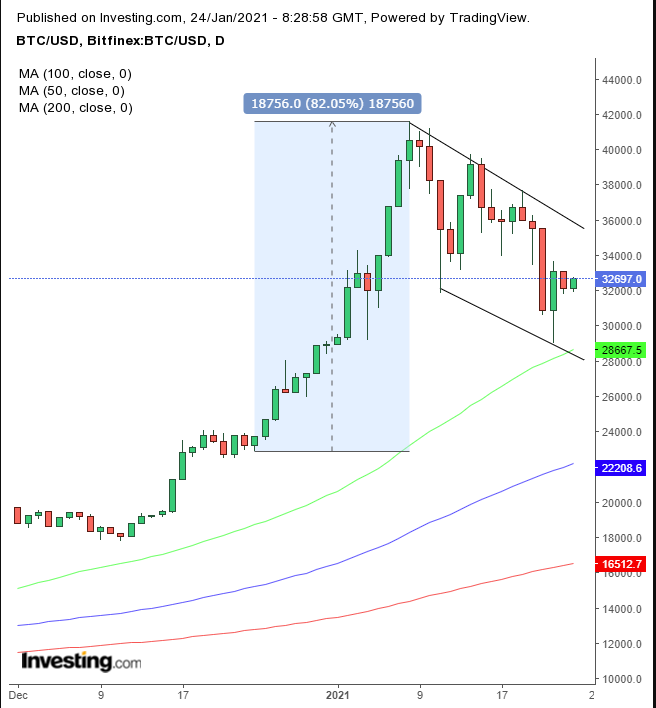
The leading cryptocurrency by market cap has been developing a falling flag. That's bullish upon an upside breakout, following the $18,756 surge between Dec. 24 and Jan. 8.
Oil fell Friday, but closed well off its lows.
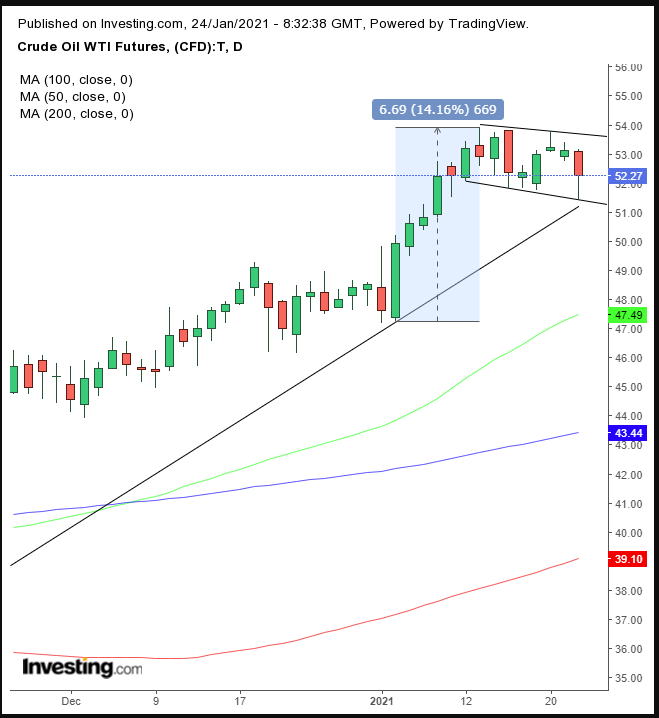
WTI's move occurred after it bounced off the bottom of a range, which met with the uptrend line. The commodity has been trading within a falling flag, bullish, upon an upside breakout, following the $6.69 jump over the seven sessions, from Jan. 5-13.
The Week Ahead
All times listed are EST
Monday
3:45: Eurozone – ECB President Lagarde Speaks
4:00: Germany – Ifo Business Climate Index: seen to edge down to 91.8 from 92.1.
Tuesday
2:00: UK – Claimant Count Change: previous print came in at 64.3K.
10:00: US – CB Consumer Confidence: expected to edge up to 89.0 from 88.6.
19:30: Australia – CPI: to drop by more than half QoQ, to 0.7% from 1.6%.
Wednesday
8:30: US – Core Durable Goods Orders: probably crawled up to 0.5% from 0.4%.
10:30: US – Crude Oil Inventories: previous weekly reading showed a drawdown of -1.975M.
14:00: US – Fed Interest Rate Decision: forecast to remain steady at 0.2%.
Thursday
8:30: US – GDP: predicted to plummet to 4.0% from 33.4%
8:30: US – Initial Jobless Claims: anticipated to decline to 878K from 900K.
10:00: US – New Home Sales: seen to rise to 860K from 841K.
Friday
4:00: Germany – Unemployment Change: expected to surge to 3K from -37K.
8:30: Canada – GDP: to remain steady at 0.4% MoM.
10:00: US – Pending Home Sales: seen to rise to -0.6% from -2.6%.
Saturday
20:00: China – Manufacturing PMI: to edge up to 52.0 from 51.9.
