- Stocks whipsawed by oppositional drivers
- Equities eke out weekly gains on low volume; yields retest June low
- Oil traders projecting gloomy economic outlook
Two oppositional drivers—trade tensions and mounting speculation of an upcoming Fed rate cut—have been whipsawing stocks, though ultimately equities ended the week slightly higher on a weekly basis. Small caps notched yet another outperformance. While small caps' superior performance finally makes sense, amid escalating trade tensions as tit-for-tat tariffs create a headwind for large caps, the consensus for a Fed cut should have boosted big caps on the outlook of a weaker dollar.
Friday’s broad retail sales gains, however, cast some doubt on what many believe is the foregone conclusion of lower rates, ending Thursday’s equity rally. The S&P 500, Dow Jones, NASDAQ and Russell 2000 all finished lower on the final day of last week's trading. We expect markets to trade within a narrow range ahead of this week's much-anticipated Fed rate decision.
We believe the Fed will attempt to strike a balance between placating the markets and steering the world’s largest economy on an interest rate path that fosters a dual mandate: full employment and price stability. It's a delicate endeavor. If the Fed refuses to feed the equity market's low-rate addiction, expect a decline as traders back-pedal from pricing in something that just wasn’t in the cards.
Equity vs Treasury Divergence Deepens
It’s also noteworthy that a midweek oil rally fizzled after attacks on two tankers near the Strait of Hormuz ratcheted up the possibility of a military conflict—provoking the U.K.'s Royal Navy to draw up plans for sending marines to protect British ships—demonstrating just how pessimistic traders are about an economic slowdown dampening energy demand. Even with Friday’s stronger U.S. economic numbers, oil barely eked out a gain.

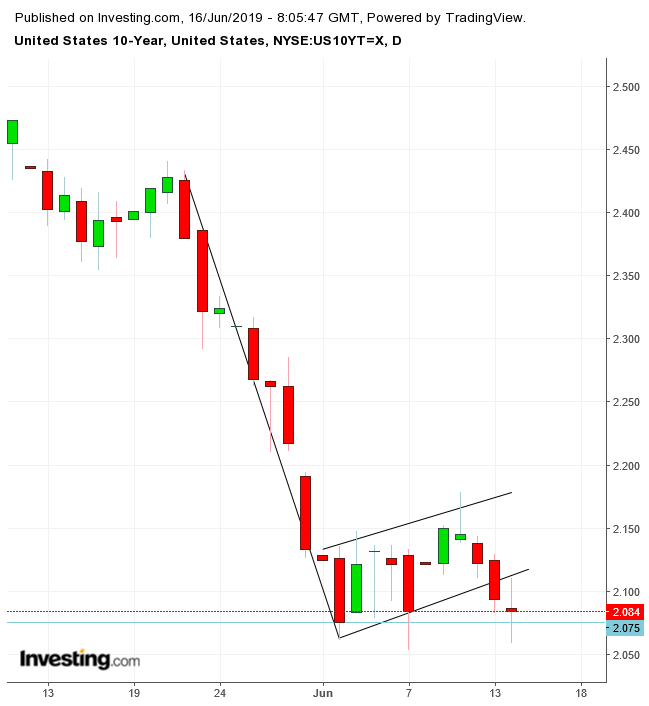
The divergence between U.S. Treasury yields and equities deepened. While both the SPX and the Dow climbed for the second week, each finishing about two percent away from respective records, yields dropped to a point less than one basis point from where they were on June 3, the lowest since Sep. 2017.
Technically, 10-year yields may have completed a rising flag, bearish after the 15% plunge seen from May 21-June 3, suggesting a repeated move downward, to retest the 2.00% key level before falling to the lowest since 2016.
Ironically, this structural paradox for markets doesn't project a difference of view on the economy. Both Treasurys and equities have climbed on the outlook of a slowdown.
Indeed, stock and bond investors are in agreement that the record economic expansion has peaked. The paradox reflects the different aims between investors of the two asset classes. Bond investors are increasing demand before a potential recession while stock investors are trading up stocks on the expected easing, whose cheaper money they hope will keep propping up share prices for some time irrespective of economic conditions.
It goes without saying that both are also pricing in a rate cut. As mentioned above, that's become a foregone conclusion for many though we've been questioning it from the start.
Stocks Gain on Low Participation
Over the course of last week, stocks lacked direction as daily contradictions within the market narrative caused prices to slalom. Equities started the week higher, as euphoric traders focused on tariffs on Mexico's imports having been averted.
On Tuesday and Wednesday, however, investors suddenly remembered the ongoing trade dispute between the U.S. and China. On Thursday, they once again forgot about that headwind as a surprise increase in U.S. initial jobless claims bolstered the argument for a Fed cut.
However, on Friday, investors refocused on the implications of the Sino-U.S. trade dispute, as a rate cut became less obvious after the jump in consumer spending—which makes up two thirds of the U.S. GDP. Looks like consumers are well positioned to continue their contribution to growth.

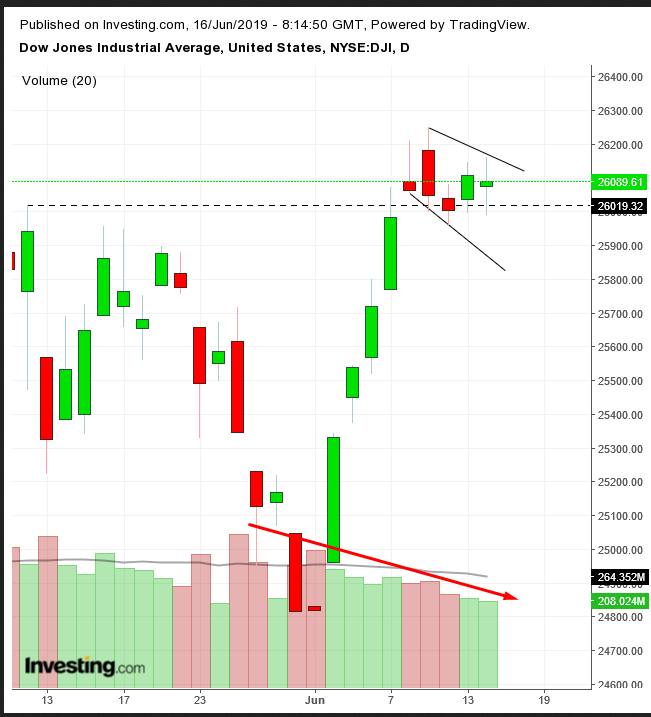
While equities advanced for the week, volume has been steadily declining. At first look, we recognized a potential rising flag, bullish after the 6.3% spike in just 7 sessions.
The location of the pattern on the map is also ideal. The price has just scaled above the May highs. Therefore, a combination of take-profits and absorption of demand of those who remember the near 5% decline from these levels in May, would result in the downward biased equilibrium typical of this continuation pattern.
Also, the price found support above the 50 DMA for the last five days, whose tracing of the 26,000 level underlines the significance of this price level. However, before we made the call that there's a developing falling flag, we noticed the volume.
In a reliable flag formation, the volume jumps on the flagpole, the sharp move that precedes the pattern, while detracting amid the changing of hands. However, in this case, the volume was falling the whole time, demonstrating that the big rally lacked participation.
The Week Ahead
All times listed are EDT
Monday
13:00: Eurozone – ECB President Draghi Speaks: The event is the annual forum in Sintra, Portugal. It's a typical market-mover, such as when Draghi sent the euro soaring with his assertion that the “threat of deflation is gone.” Look for hints of a rate cut or even bond purchases.
21:30: Australia – RBA Meeting Minutes: Australia’s recent economic checkered data has left traders guessing as to the timing of the next expected rate cut, July or August.

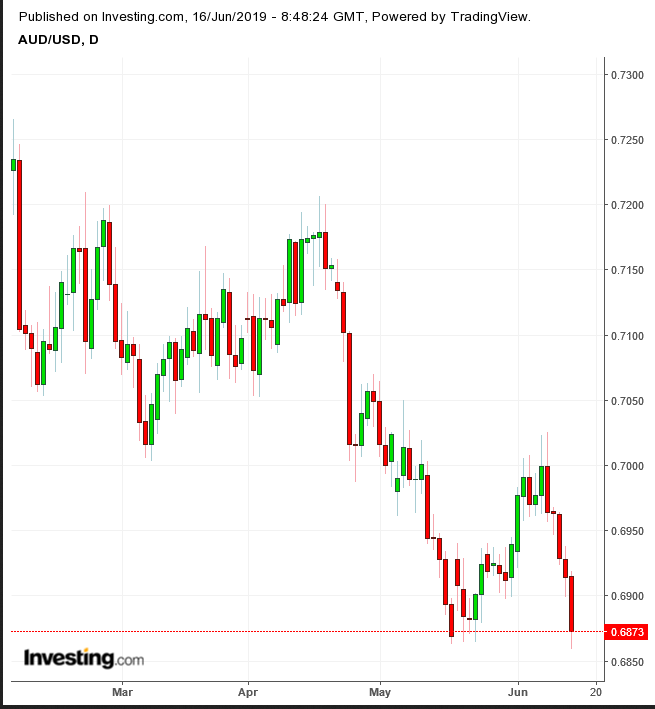
The Aussie closed Friday merely 0.06% above its May 17 low. However, Friday’s trough already posted a lower trough, the lowest since January 16. Therefore, strictly speaking, Friday’s trading extended the downtrend.
Tuesday
4:00: Eurozone – ECB President Draghi Speaks: the second time during a three-day event.
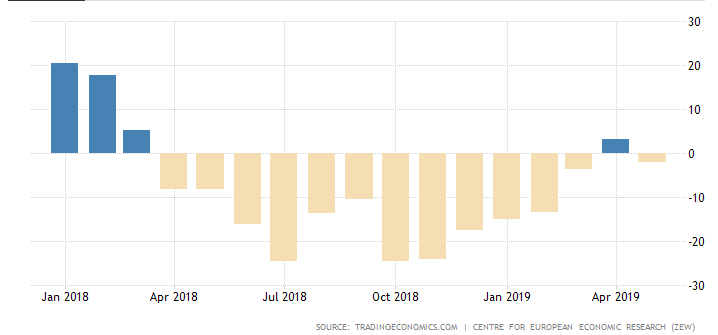
5:00: Eurozone – German ZEW Economic Sentiment: The ZEW Indicator of Economic Sentiment for Germany dropped by 5.2 points from the previous month's 13-month high, which was its first positive month since March 2018. The indicator fell to -2.1 during May 2019, missing market expectations of 5.0.

5:00: Eurozone – CPI (YoY) (May): Investors expect it to remain flat at 1.2%.
8:30: U.S. – Building Permits: likely to have eked out a gain, going to 1.300 million from 1.290 million.
10:00: U.K. – BoE Gov Carney Speaks: In his final speech as his 6-year tenure winds down, Carney will likely not make waves by discussing anything controversial such as Brexit or Trump; expectations are he'll stay away from politics.
Wednesday
4:30: U.K. – CPI (YoY) (May): analysts expect this metric to slip slightly, from 2.1% to 2.0%.
8:30: Canada – Core CPI (MoM) (May): previous read: 0.0%.
10:30: U.S. – Crude Inventories: likely fell to -0.481 million from 2.206 million previous.
14:00: U.S. – FOMC Economic Projections, Statement, Fed Interest Rate Decision, Press Conference: The dollar leaped 0.6% after the release of Fridays retail sales numbers. It was the third day of gains for the global reserve currency for a total rise of 0.91% ahead of this, perhaps the main economic event of the week.
18:45: New Zealand – GDP (QoQ) (Q1): likely to have remained flat at 0.6%
Tentative: Japan - BoJ Monetary Policy Statement, Interest Rate Decision: central bank Governor Haruhiko Kuroda is walking a tightrope between waning inflation and low yields that are sapping commercial bank profits.
Thursday
4:30: U.K. – Retail Sales (MoM)(May): expected to slump to -0.5% from 0.0%
7:00: U.K. – BoE Interest Rate Decision: Consensus says it remains at 0.75%.
8:30: U.S. – Philadelphia Fed Manufacturing Index (June): expected to have fallen to 10.6 from 16.6.
Friday
3:30: Eurozone – German Manufacturing PMI (June): Likely rose to 44.6 from 44.3.
8:30: Canada – Core Retail Sales (MoM) (Apr): forecast to drop to 0.6% from 1.7%.
10:00: U.S. – Existing Home Sales (May): seen to have jumped to 1.2% from -0.4%.
