- Unprecedented divergence between stocks and the economy
- Bulls relying on Fed turning dovish, pointing at history
- Goldman believes economy will remain healthy
- Gundlach declares there's already a bear market
The S&P 500 and Dow Jones Industrial Average each finished the week lower: The first two-day rally for both indices was halted ahead of the weekend, with the Energy sector underperforming (-0.83%), as it tracked another day of losses for oil.
Still, the S&P 500 gained for the week (+2.86%), for the first time in December. Technology shares finished higher (+3.72%) as did Financials (+3.51%).
Where To For SPX? Watch These Levels
Last week, ahead of Monday's open, we noted that a weaker dollar would boost equities. The dollar was indeed weaker, and equities did in fact push higher. We also expected a short-term rally, which materialized...with a vengeance. The major averages gained about 5% over the course of the week, with some big daily moves that haven't been seen in years. On Wednesday, the Dow made history, taking its best-ever, one day jump to gain 1,086 points, a new record.
However, volatility also increased, leading to Thursday’s declines and a return to the brink of a bear market before the stage was set for the biggest reversal in a decade.

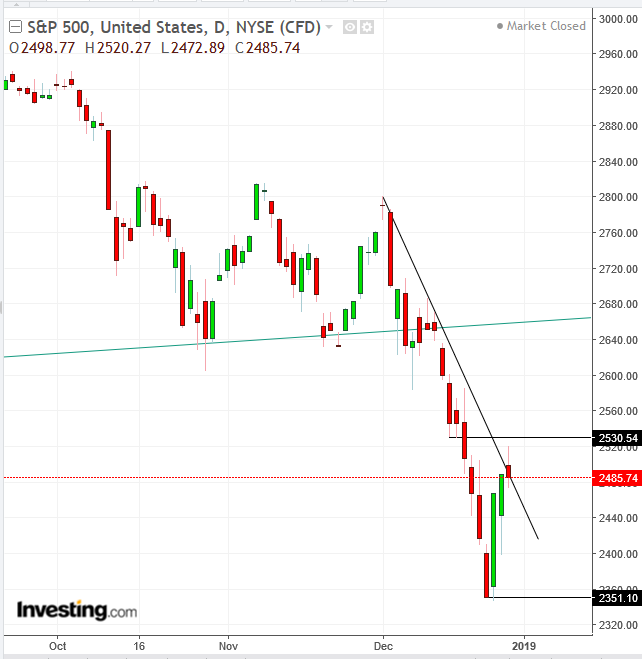
The S&P 500 Index found resistance at the December downtrend line. With President Donald Trump boasting over the weekend of “big progress” in trade talks with China, on Monday, markets may resume their upward correction toward 2,700. Dovish Fedpseak late in the coming week, could further boost positive sentiment.
Technically, a close above Friday’s 2,520.27 high would be a good sign. On the other hand, should prices close below 2,350, the longest bull market on record could be history.
Equities Vs. Economy: A Sign Of The Times
Most stocks ended lower on Friday. This leaves investors with a dilemma. They'll have to decide whether to focus on the day's losses or the week's gains. This is a time for reckoning, when market participants must find their own direction amid conflicting signals.
Does the worst pre-Christmas session ever, on December 24, represent the overall supply-demand balance, or was Thursday’s biggest reversal since 2010 the appropriate signal? Choosing between two starkly opposing narratives is a sign of the times; stocks are set for their worst year since the 2008, even while it’s been the best year for GDP since 2005.
The market is supposed to reflect the economy. The former, however, tends to turn before the latter, as forward-looking investors price in economic changes. Therefore, the stock market is an economic leading indicator.
While analysts attempt to explain the apparent contradiction between economic activity and the current investor outlook by saying the economy has peaked, we reject that as a simplistic, textbook explanation. The stock market should have peaked and started a slow decline ahead of the economy, not be on the verge of a bear market within three months of hitting a new all-time-high.
These developments reflect extreme investor pessimism even amid the most optimistic economic growth in a decade. The fact is, markets have reflected investor pessimism over numerous time frames preceding the economic peak. Working backward, 2018 has been:
- The worst year for stocks since 2008
- Stocks remain on track for the worst December since 1931
- The market had the worst monthly start in December since the Great Depression
- October was the worst full month for equities since 2011
- Despite solid first-quarter earnings reports, the second quarter saw markets slide into the second worst Q2 since the Great Depression. Equities gained little traction during that period as geopolitical and trade concerns hampered markets.
Here’s perhaps the most recent, noteworthy gauge. Amazon (NASDAQ:AMZN) announced last week, it had experienced record-breaking holiday sales. This was one of the key catalysts for Wednesday's market exuberance, one of the best days ever for stocks. The retail behemoth's holiday season signaled that the state of consumer spending—which makes up two thirds of the US's GDP—was alive and well, despite investors' pessimistic outlook. Amazon shares soared 9.6%. Nevertheless, the stock is on track for its worst quarter since 2008.
What's Driving This Dichotomy?
While it’s presumptuous to claim to know the one, correct answer, we can guess at a few critical factors:
Record Buybacks: Through the first quarter of 2018, US corporations set a record, at $189.1 billion, for most shares repurchased for a quarter—a 38% increase from the previous quarter, according to a report from the S&P 500 Indices. In May, these same corporations set a new monthly high, $173.6 billion, in stock buyback announcements.
Trade War: On April 2, China imposed tariffs of up to 25% on 128 American products worth an estimated $3 billion. This was done in retaliation for President Donald Trump’s 25% tariffs levied on steel and aluminum imports from China, which were put in place on March 23. The US president said that trade wars are “good” and “easy to win.” Consensus among economists, however, is that that both sides lose.
Interest Rates: We have argued that the real driver of market selloffs will prove to be the removal of the most accommodative monetary policy in history. Fact is, for all the headlines—and brief drawdowns—generated by the trade dispute, stocks kept coming back, making new highs. However, the recent rout, which has taken us to the verge of a bear market, was triggered by the Fed’s outlook for one additional, unexpected hike next year, even when trade negotiations were looking up...for the first time in months.
Optimists maintain that the Fed will turn more dovish as market volatility increases and stocks fall, pointing at history, even after Fed Chair Powell stated that the central bank's considerations exclude what is happening in financial markets. This view presumes that the Fed is a homogeneous body, rather than a group of disparate individuals. That would be like expecting the current president to act like his predecessor.
Goldman Sachs cut its growth forecast for the first half of 2019 from 2.4% to 2%, while emphasizing it was “still not particularly worried about a recession." The bank bases its confidence on the lack of two key leading indicators for a recession: inflationary overheating and asset market bubbles. The good news for the economy, GS added, remains solid employment figures and contained price pressures.
Goldman expects the unemployment rate to continue its downward trend, and hitting 3.25 percent by the end of next year. The tighter labor market and higher tariffs from the U.S.-China trade battle will result in modestly higher inflation, pushing up core prices to 2.1 percent, according to Goldman.
Bond King Jeffrey Gundlach says the S&P 500 has already entered bear market irrespective of the “very arbitrary” 20% gauge.” He points out, “it’s more how you lead into it, how it develops, how the sentiment changes, and I think we’ve had pretty much all the variables that characterizes a bear market." He said this on December 11, when stock markets were only 11 percent lower since the September record peak. It was also one day after we warned of a market top.

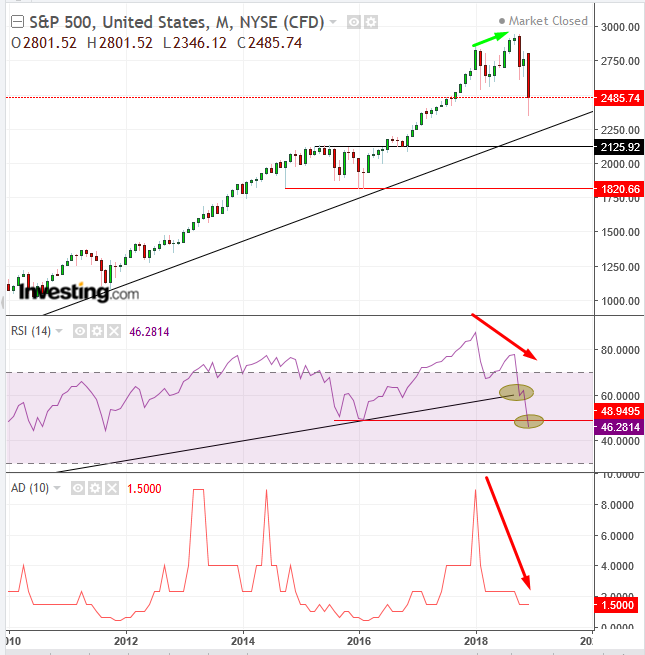
While the next major support for the S&P 500 is the 2015 high of 2,100, the RSI suggests the price will fall even lower. The momentum indicator fell below its uptrend since the 2009 bottom, and the RSI dipped below its 2015 bottom (red line). Both events suggest prices may follow there too.
Note, as well, that while the price rose from the January record to the September record, both the RSI, which measures momentum, and the Advance Decline Line, which measures market breadth (participation) provided a negative divergence, further suggesting prices may follow.
The Week Ahead
All times listed are EST
Sunday
20:00: China – Manufacturing and non-Manufacturing PMI (December): manufacturing to remain steady at 50, while non-manufacturing PMI to fall to 53.2 from 53.4.
Monday
None
Tuesday
New Year’s Day Holiday: major global markets are closed
20:45: China – Caixin Manufacturing PMI (December): this private survey is expected to see the PMI edge higher to 50.3 from 50.2.
Wednesday
4:30: UK – Manufacturing PMI (December): expected to drop to 52.6 from 53.1.
Thursday
4:30: UK – Construction PMI (December): forecast to decline to 52.9 from 53.4.
8:15: US – ADP Nonfarm Employment Change (Dec.): 180K jobs expected to have been created, edging up from 179K.
10:00: US – ISM Manufacturing PMI (December): expected to fall to 58.2 from 59.3.
20:45: China – Caixin Services PMI (December): index to fall to 53.1 from 53.8
Friday
3:55: Germany – Unemployment Rate (December): unemployment to hold at 5%.
4:30: UK – Services PMI (December): expected to rise to 50.8 from 50.4.
8:30: US – Nonfarm Payrolls (December): 181K jobs expected to have been created, from 155K last month, while unemployment rate expected to hold at 3.7%. Average hourly earnings forecast to rise 0.3% MoM from 0.2%, and 3% YoY from 3.1%.
8:30: Canada – Employment Report (December): net change in employment +5K. Unemployment rate to rise to 5.7% from 5.6%.
11:00: US – EIA Crude Inventories: likely to rise further, a negative for crude.
