- All major US indices now positive YTD
- Utilities underperform as higher, secure yields attract investors
- Equity investors continue to focus on bottom line, ignore geopolitical risk
- All markets, even oil, take end of Iran deal in stride
- Best earnings season since Q3 2011
- S&P 500 Index completes Symmetrical Triangle, while crossing above 100 DMA
- Yields expected to continue climbing
- VIX still higher than almost all of 2017
US Stocks Turn Positive For the Year
Save for the NASDAQ Composite, which finished the week lower by a sliver, down just -0.03% on Friday, all major US indices finished the week on an up note—the Dow higher by 0.37%, the S&P 500 gained 0.17% on the day, and the Russell 2000 advanced 0.19%. As well, it was the first weekly gain for the Dow and S&P in three weeks.
For the tech heavy NASDSAQ and the small cap Russell 2000, whose domestic firms have not been threatened by US President Donald Trump's tariffs, it's the second straight week of gains. For the S&P 500, Dow and Russell 2000 it was the best weekly performance in 10 weeks, whereas for the NASDAQ it was the strongest performance in 6 weeks.
The Dow Jones Industrial Average advanced 2.35 percent for the week; the NASDAQ Composite climbed 2.7 percent and the Russell 2000 advanced 2.6 percent.
Could it be the bulls are back in control of the equity market? A number of signs, both technical and fundamental, point to US stocks having completed a bottom, at least for now.
S&P 500 Milestones
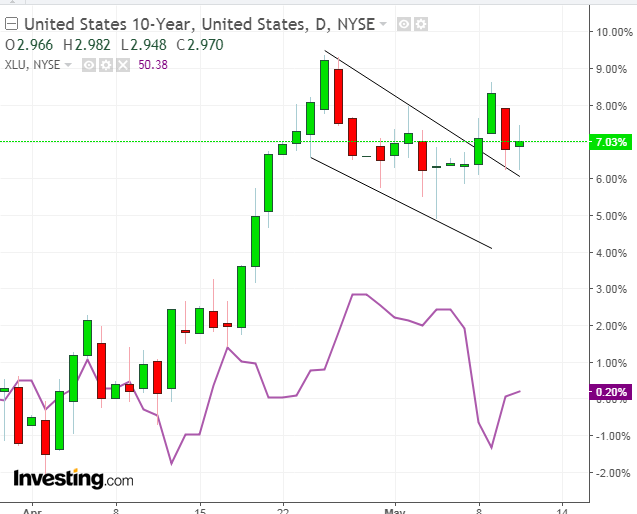
The S&P 500 Index gained 2.4 percent for the week, led by Energy shares (+3.9 percent), as WTI crude broke $70 for the first time since late 2014. The second best performing sector was Financials (+3.63 percent), after 10-year Treasury yields crossed over the 3-percent psychological round number during the week for the first time since December 2013 and closed 3 basis points below at 2.97. Higher yields suggest an outlook for higher rates, which translate to higher bank lending margins and therefore profitability.
To complete the bullish picture, the only two sectors in the red were defensive sectors: Utilities (-2.19 percent), whose yields have become less appealing in comparison to rising secure Treasury yields, and Consumer Staples (-0.3 percent).
Notice the negative correlation in the chart above between the two assets. Therefore, when yields retreated from 3% on Wednesday, Utilities rebounded proportionately.
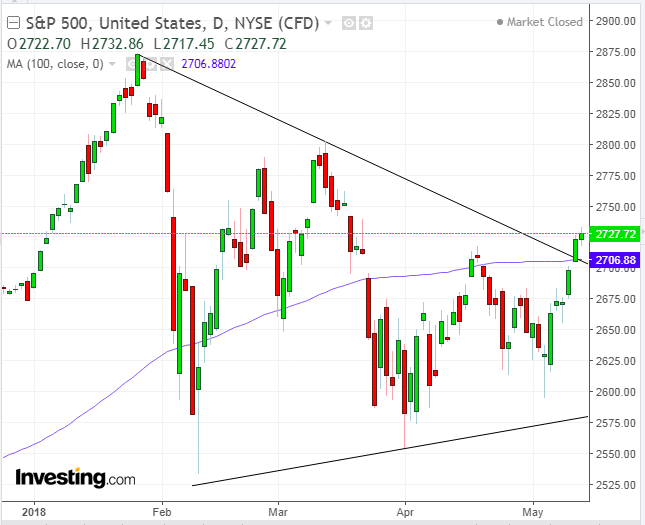
The S&P 500 Index achieved two technical milestones last week. It crossed above the 100 DMA for the first time since mid-April and may have completed a Symmetrical Triangle that has been developing since the January 26 record.
In terms of filters to avoid a bull-trap, as far as a time filter, the price has, for two days, closed above the triangle top, one of which is particularly significant since it was the Friday close. Willingness by traders to remain exposed throughout a weekend expresses confidence. Regarding a price depth filter, the price penetrated 0.85 percent above the triangle top, not even satisfying the aggressive 1.00 percent filter, as of now.
Bottom Line Driving Sentiment
Equity investors have remained consistent in zeroing in on the bottom line while turning a blind eye to geopolitics. Indeed, both equity and oil markets had muted responses to Trump's withdrawal from the Iran nuclear deal.
Were expectations of the withdrawal priced in, or do investors only care about earnings? More than 90 percent of S&P 500 listed companies have already reported first quarter results, and with nearly 80 percent of companies beating both earnings and revenue estimates the numbers have been stellar—8.2 percent average revenue growth, the biggest since the third quarter of 2011. Also, Factset forecast 24.9 percent YoY growth for the S&P 500 Index.
The price of WTI crude climbed a less startling 1.5 percent on Tuesday, when the president announced he was ending the Iran deal. To be fair, however, there is a lengthy process between the initial announcement and the actual reduction of Iran's contribution to the global oil supply.
While the announcement does not yet impact oil supply, it will most certainly affect the already tense Middle East, where the Israel-Iran conflict escalated after President Donald Trump announced the end of the 2015 multinational nuclear deal. Still, US investors don't seem to believe this will interfere with the much talked about synchronized global growth that provided the impetus for the current earnings beats.
US 10-year yields (see chart above) found support Thursday and Friday at the top of a completed bullish Falling Flag, with a 1.7 percent upside penetration. Should yields in fact resume their upward trajectory, reaching the flag's implied target of 3.14 percent—the highest level since mid-2011—implying a much faster pace of tightening, how might that affect equities?
Though the recent stock contraction was initially triggered by rising yields, last week's consumer price index release indicated that inflation has remained muted. Traders reacted very bullishly on Thursday to April's core inflation (excluding volatile food and energy prices) increasing only 0.1 percent, after two straight monthly increases of 0.2 percent and a forecast for a third month with the same increase.
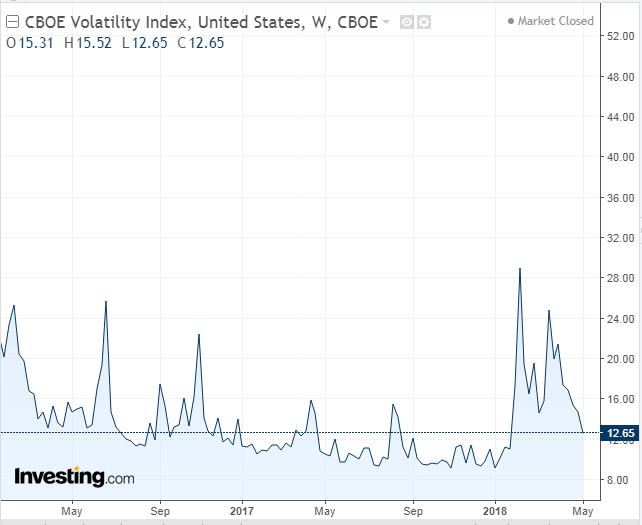
Finally, while the VIX has decreased by half since mid-March, it is still higher than it was during all of 2017, with the exception of a few weeks in April and a couple of weeks in August. This suggests that investors expect more volatility is on the way.
Week Ahead
All times listed are EDT
Monday
21:30: Australia – RBA Meeting Minutes: The Reserve Bank of Australia expects faster growth and low inflation. This is the same recipe for a Goldilocks economy investors read into the most recent US Nonfarm Payroll decrease in unemployment, 3.9 percent, the lowest in 18 years, which was reiterated by lower than expected CPI inflation.
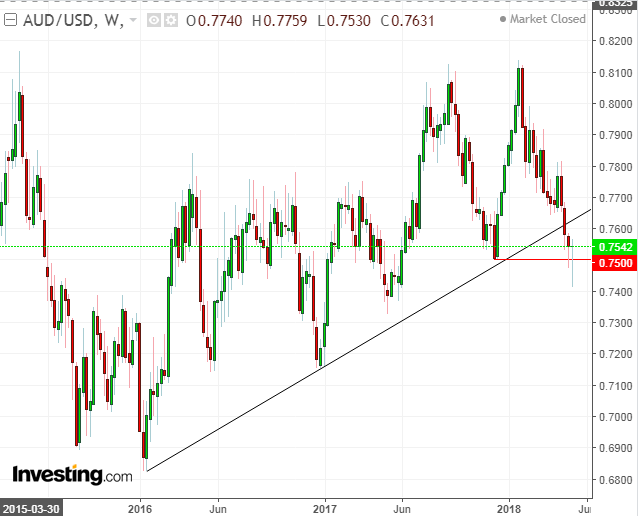
Meanwhile, the AUD/USD pair crossed below its uptrend line from the start of 2016. It's now flirting with completing a double-top, whose implied target is 0.6900.
Tuesday
2:00: Germany – GDP (Q1, flash estimate): expected to rise by 0.5% QoQ, from 0.6%, and 2.8% YoY from 2.9%.
4:30: UK – Employment Data: March unemployment rate to rise to 4.3% from 4.2%, while April claimant count rises by 5K from an 11,600 increase. March average earnings to rise 3% from 2.8%.
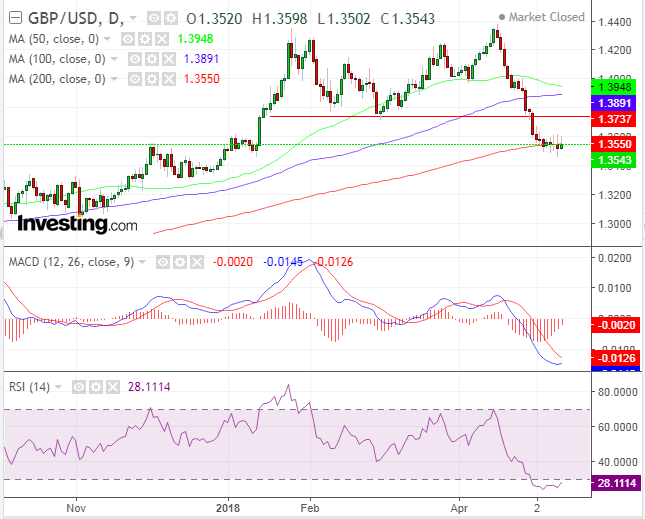
While the pound completed a double-top, implying a 1.32 target, the RSI is oversold and turning upwards, while the MACD is about to cross over into a buy signal, all while the price is on top of the 200 DMA, suggesting a return move to the 1.3737 neckline.
5:00: Germany – ZEW (May): economic sentiment expected to be -1 from -8.2.
5:00: Eurozone – GDP (Q1, 2nd estimate): QoQ growth expected to be 0.4% from 0.7% and 2.5% from 2.8% YoY.
8:30: US – Retail Sales (April): expected to rise 0.4% from 0.6%.
21:50: Japan – GDP (Q1, preliminary): expected to be 2.4% from 1.6%.
Wednesday
5:00: Eurozone – CPI (April, final): no change to previous reading expected.
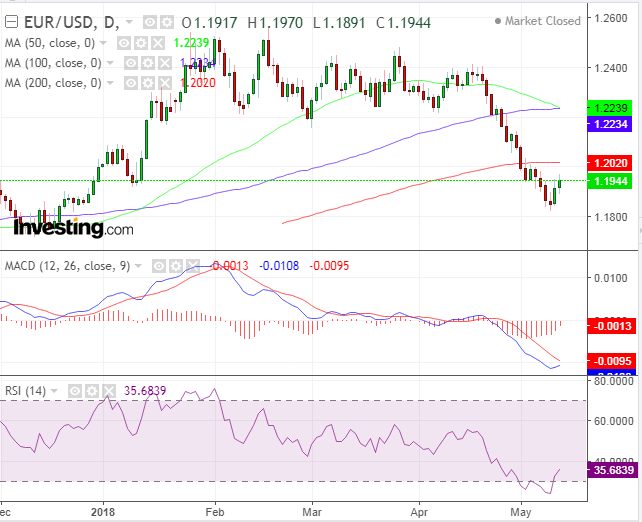
While the euro fell below the 200 DMA (red) two weeks ago, and the 50 DMA (green) is about to cross below the 100 DMA (blue), the RSI has just bottomed from an oversold condition, while the MACD is about to cross over, providing corrective buy signals.
8:30: US – Housing Starts and Building Permits (April): starts to rise by 0.4% and permits to be 0.6% higher.
10:30: US – EIA Crude Oil Inventories (w/e 11 May): stockpiles expected to rise by 90,000 barrels.
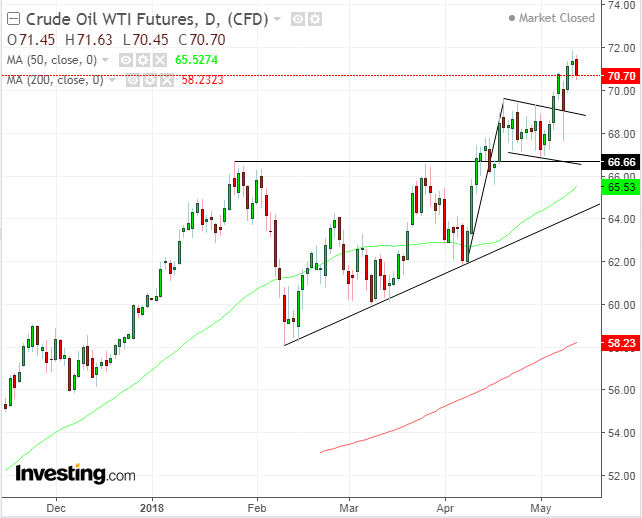
Trump's withdrawal from the Iran deal last week led to a selloff that dipped deeply into the bullish Falling Flag but found support and closed above it, so that oil continued higher in the next couple of days. The flag's implied target is $76.50.
Thursday
8:30: US – Philadelphia Fed Manufacturing Index (May): The consensus forecast is 22.0 for May's Philly Fed which in April, belying the 23.2 headline, showed sharp slowing for both new orders and backlogs. But prior rates of order growth were very strong in this report; stresses on current production have been evident with both delivery delays and the work week near 50-year records and both input and selling prices at expansion highs.
19:30: Japan – CPI (April): expected to be 1.4% YoY from 1.1%, and 0% MoM from -0.4%.
Friday
8:30: Canada – CPI (April): expected to come in at 0.4% from 0.3% MoM previously; expected to be 2.3% YoY, in line with last month.

