by Pinchas Cohen
The Week That Was
This past week, all four major US indexes achieved new record closes, all posted on Monday at the start of weekly trading.
From a fundamental perspective, investors looked to be milking the last full week of trade before year-end, buoyed by the promise of the biggest tax overhaul in decades and more than 13 months of market chatter pushing the narrative that tax reform would be extremely bullish for stocks. We use the term 'milking' deliberately. Investors have been bombarded recently by endless predictions that markets in 2018 won't be able to repeat the extraordinary gains of 2017, which in itself was the best year since 2013.
Technically, all four major US indices—the S&P 500, Dow Jones, NASDAQ Composite and Russell 2000—opened the trading week with rising gaps, an area indicating no price action, forming a visual gap on the chart. This occurs when buyers find no available supply at current prices and raise the stakes till they find willing sellers. While on the face of it the over-eagerness of buyers appears bullish, it also holds the potential for an “exhaustion gap,” as the previous demand is dried out, which could precede a selloff.
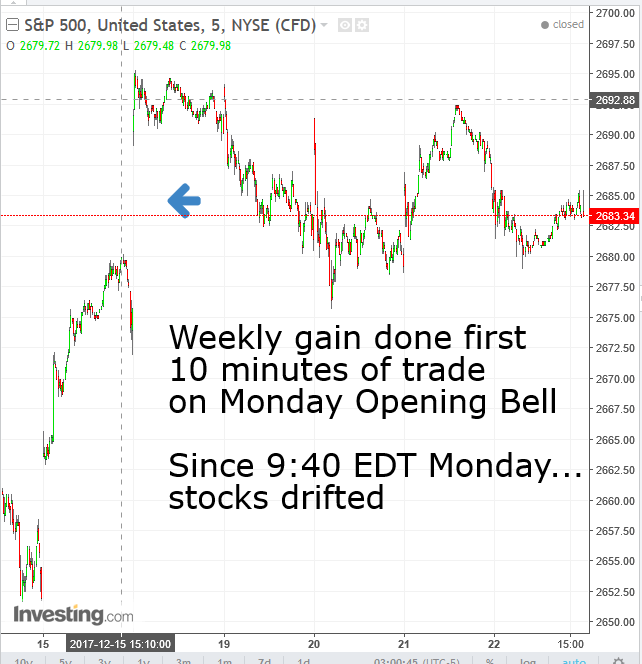
The S&P 500 Index advanced 0.29 percent, paring a 0.89 percent gain, and the Dow Jones Industrial Average rose 0.44 percent, down from its 0.89 percent high. The rising gap of these indexes has a higher potential of turning out to be an exhaustion gap, as their preceding moves were sharp.
The NASDAQ Composite gained 0.33 percent after giving back the difference to a 0.98 percent advance. Its rising gap has a lower potential of turning into an exhaustion gap, since its earlier prices were more congested, allowing profit-taking for those who brought prices this far and for fresh blood to take it up for another rally.
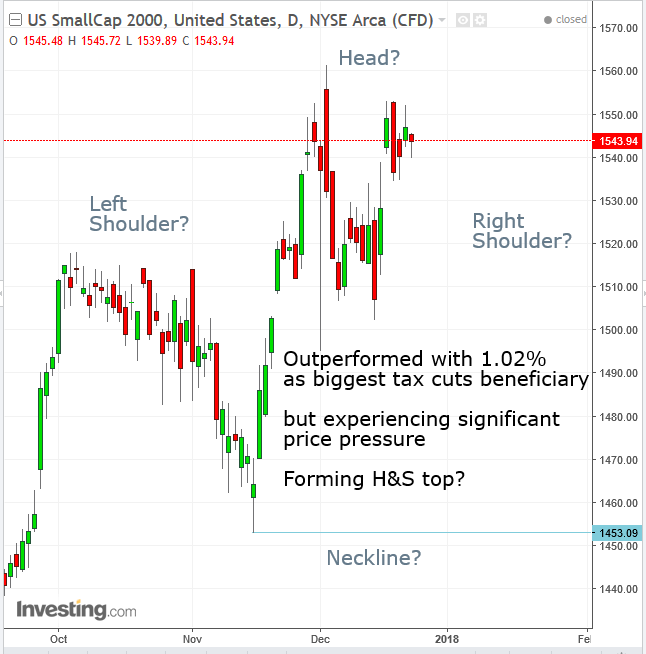
The Russell 2000, which we've repeatedly said stands to gain the most from tax cuts, outperformed, advancing 1.02 percent, easing from a 1.6 percent high. Its exhaustion gap is meaningless, as well as harmless, as it’s an “area gap,” meaning preceding prices were already higher because traders were already willing to take prices higher from the current levels. In other words, there remains potential demand.
The bottom of a rising gap generally provides support to the price, as investors remember the literal leap and are likely to step back into the fray for yet another try. While it is a myth that gaps must be filled—when prices correct, hitting all the prior missed prices, and indeed there is a trading strategy that calls for shorting after a rising gap (alternatively, buying after a falling gap), most do fill, or come close. Three of the four gaps filled, while the Dow maintained a light, 0.6 percent gap.
The Dow formed a weekly shooting star, which occurs when bears push back a bullish advance, suggesting that at the end of the day (or in this case, the week) they are in charge.
The S&P 500 formed a High Wave candle, something that occurs when prices rise and fall but close with no discernible change. This behavior takes place when there's no market leadership, because traders have no clue how to proceed. This candle often forms before reversals.
On Monday, the price action formed a Shooting-Star, in which the bears had the last word. Sure enough, the resistance held throughout the week, receiving confirmation by the high wave candle.
The Russell 2000 also formed a weekly high wave candle, after completing a powerful daily Bearish Engulfing pattern on Tuesday, in which the bears stopped a major advance and sent the bulls back deep into the prior day’s advance.
Market Internals: Growth Stocks Advance, Defensive Shares Fall (But It's Not What You Think)
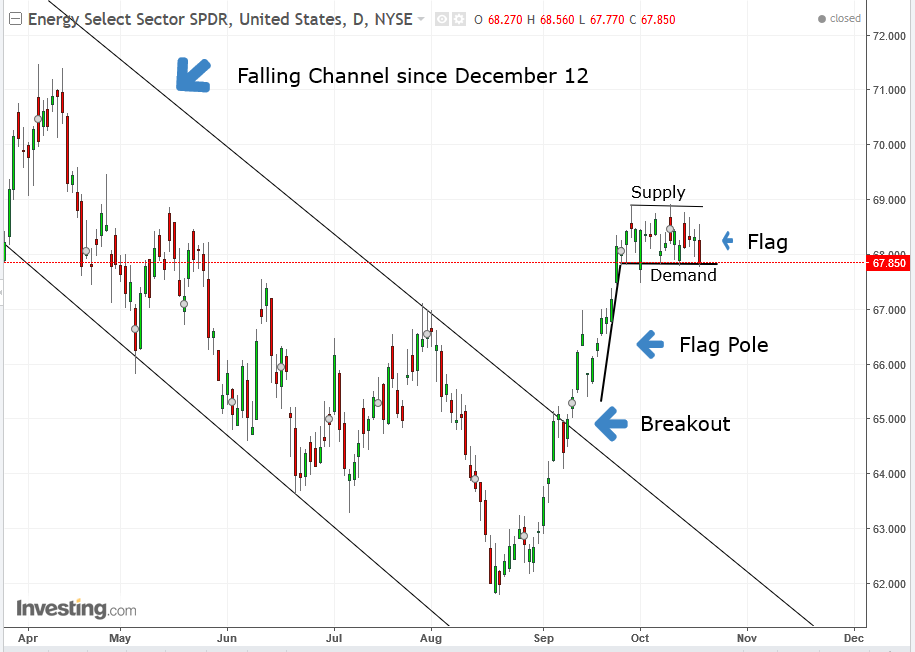
Energy, a growth sector, outperformed with a 4.73 percent jump, as the sector is seen to be the biggest beneficiary of the tax overhaul, according to MarketWatch's corporate tax calculator, reported last Monday by Forbes. The calculation shows that the energy sector’s median tax rate for the past 11 years was 36.8, far above the 30 percent company average for firms on the S&P 500. More importantly, it’s significantly higher than the 27.5 effective tax rate for financial firms, which till now were considered to be the firms with the highest effective tax rate.
However, a more direct trigger for the energy sector performance was the recent price of oil. The Forbes article was published on Monday, but the energy sector didn't see major gains until Thursday, when it rose 2.16 percent, the biggest one day jump of its 4.69 percent weekly advance.
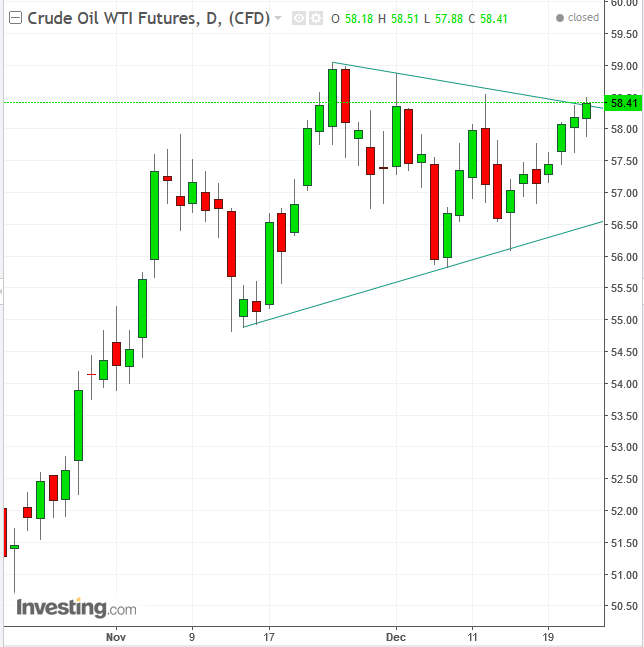
This occurred one day after WTI crude oil jumped by 0.75 percent on Wednesday, its biggest one day jump of its weekly 1.98 percent advance. It reflects the effect of growth outside the US and the demand for oil imports. The price of oil finished the week at $58.41 a barrel, the highest closing for the commodity since November 20, and just 0.56 percent below. A higher close will be the highest since June 30, 2015.
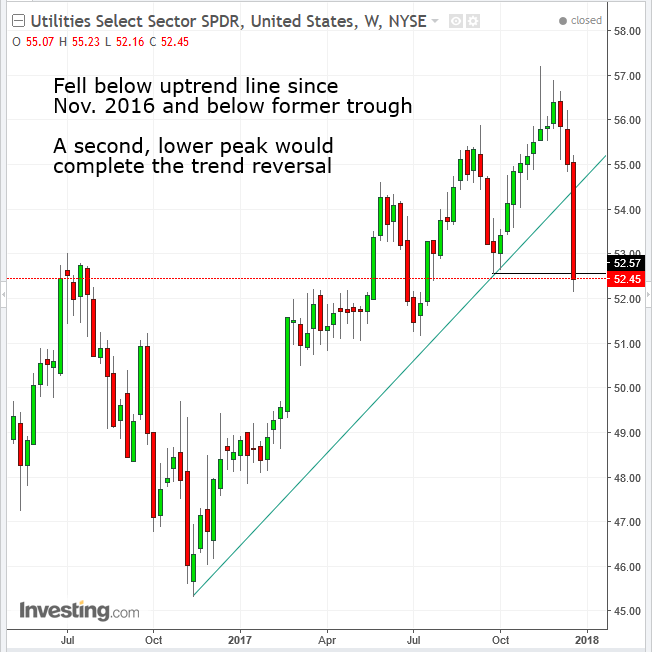
Utilities, a defensive sector, was the biggest laggard with a 4.67 percent retreat, the mirror image of the Energy sector. That's despite the fact that the new tax plan would have a positive affect on the sector. In addition to slashing the tax rate from 35 to 21 percent, it would also allow these companies to deduct 100 percent of the cost of capital projects from their taxes in the first year the plan goes into effect, rather than smaller deductions over time.
The primary reason for the sector selloff were massive losses by California’s two major utilities, Pacific Gas & Electric (NYSE:PCG), whose shares plunged 12 percent on Thursday, a day after the company announced that it was suspending its dividend due to “uncertainty related to causes and potential liabilities associated with the extraordinary October 2017 Northern California wildfires.” It’s the biggest decline for the stock since August 2002. This selloff is its second largest historically; the first was on concerns about the company’s potential liability for the wildfire, underscored Wednesday when PG&E admitted that it had not yet discovered the cause for the October wildfire.
The other perpetrator was Edison International (NYSE:EIX), which dropped 6.7 percent on Thursday, propelled by the PG&E announcement, bringing its total loss to 22 percent for the month. This after the company recently conceded during an investigation into another lethal wildfire in the southern region of the state that it is acknowledging “the possible role of its facilities.”
So while US indices indeed broke new ground early in the week, they have also met with major selling resistance as the week headed toward its close. While a growth sector led the rally and a defensive sector retreated, it is the result of specific fundamentals, not a reflection of overall market sentiment.
Bitcoin's 'Black Friday'
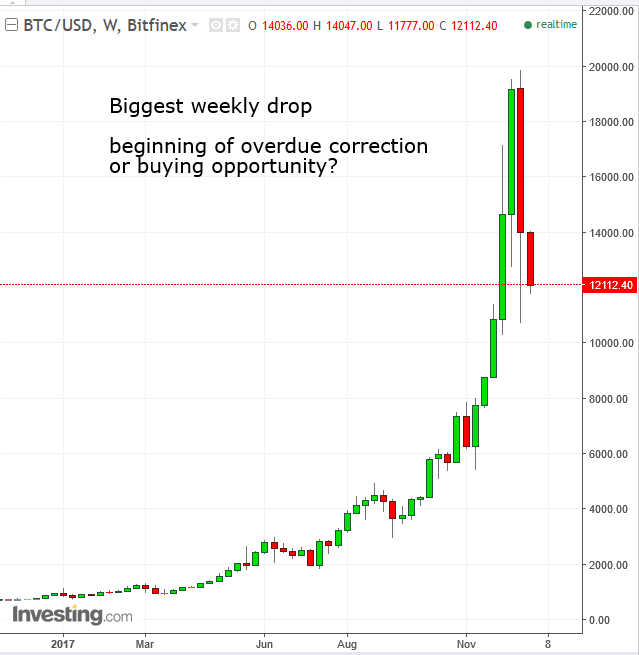
Perhaps cryptocurrency investors had the roughest week of all. Bitcoin diehards in particular saw gains evaporate with a heart-stopping 44 percent overall plunge on a 27 percent decline. While the most famous cryptocurrency rebounded 6.9 percent on Saturday, the selloff then extended, wiping out Saturday’s gains as it continued to fall lower than Saturday’s low.
It's not clear why this is happening now, but some believe the selloff may have been sparked by China’s biggest Bitcoin exchange BTCC no longer accepting deposits in Chinese yuan, as of January 1. Others suggest that investors are cashing out after seeing stellar gains, in order to profit before the holidays.
On Friday, Bitcoin was strongly in the red, after a panicked selloff saw it reach a $10,891.32 low, a loss of more than a third from the previous day’s close, according to Coindesk data. One of Bitcoin’s biggest bulls, Mike Novogratz, said on Friday that he’s pausing a planned launch of a crypto fund, after earlier in the month forecasting the digital currency would reach $50,000 next year. He told Bloomberg: “We didn’t like market conditions and we wanted to re-evaluate what we’re doing.” He now expects a correction in the digital currency to go as low as $8,000 over the coming three-to-four months before it hits $20,000 again.
Morgan Stanley just published a report stating that the real value of Bitcoin might be $0. The report does not assign a price target for the alt-currency and elaborates why it’s impossible to determine its value since it's neither like a currency, with no interest rate, nor like gold, which can be valued via weight, electronic usage or jewelry.
Gold
Gold had a great week, advancing 1.75 percent for the second week in a row, showing that even if a growth sector such as energy rises, while a defensive sector such as utilities falls, investor sentiment isn't necessarily risk-on.
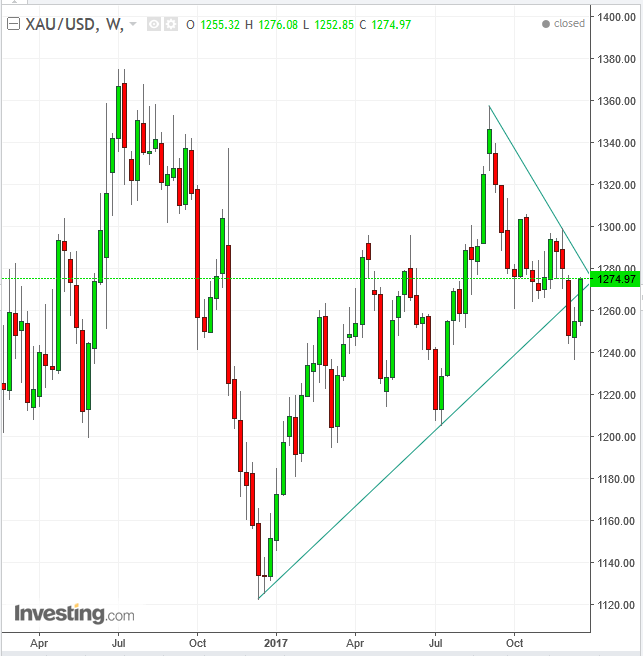
Still, the price of the precious metal stopped short of a confluence of its broken uptrend line since December 2016 and its downtrend line since September.
US Dollar
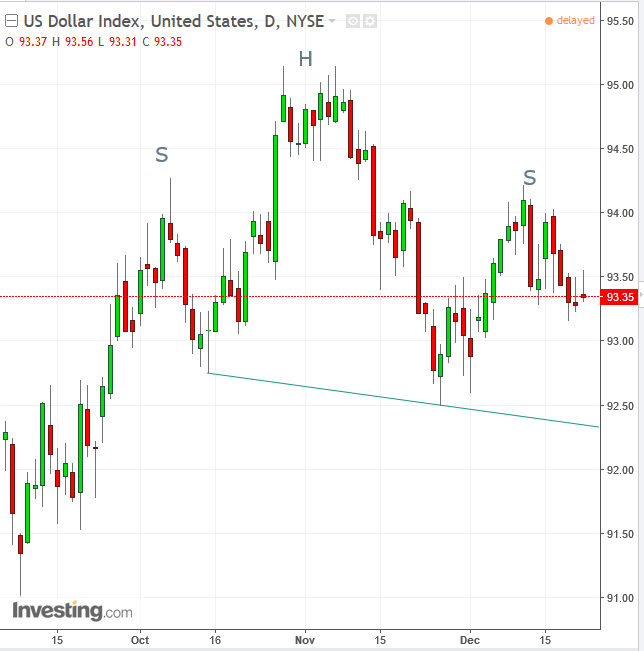
The greenback fell 0.6 percent this past week, on profit-taking by dollar bulls after tax reform / the Fed rate hike / New Fed Chief Powell’s bias toward easing regulations, as the slower holiday season looming. Another factor spurring selling: the end of 2017, which is expected to have been better for the reserve currency than circumstances forecast for 2018.
The Week Ahead
All times listed are EST
Monday
Christmas Holiday – US, UK, Most Other Developed Market Exchanges Closed
6:30: Japan – Unemployment and Inflation (November): unemployment expected to hold at 2.8%, while inflation rises to 0.8% YoY from 0.2%.
Tuesday
Boxing Day: UK, Australia, Canada, New Zealand; Christmas: Hong Kong, Italy
10:30: US – Dallas Fed Manufacturing Index (December): forecast to rise to 20 from 19.4.
Wednesday
10:00: US – Pending Home Sales (November): forecast to rise 0.5% YoY, and 1.2% MoM, from -0.6% and 3.5% respectively.
Thursday
8:30: US – Initial Jobless Claims (w/e 23 December): claims expected to be 236K, from 245K a week earlier.
9:45: US – Chicago PMI (December): expected to fall to 63 from 63.9.
11:00: US – EIA Crude Oil Inventories (w/e 22 December) [delayed by a day due to Christmas Day]: previous reading saw a fall of 6.5 million barrels.
Friday
8:00: Germany – Inflation (December, preliminary): price growth expected to be 1.5% YoY from 1.8%.
