Over the last decade, the most influential central banks around the world have printed electronic currency credits to acquire $14 trillion in assets. The effect on stocks, bonds and real estate? Remarkable price gains as well as records galore.
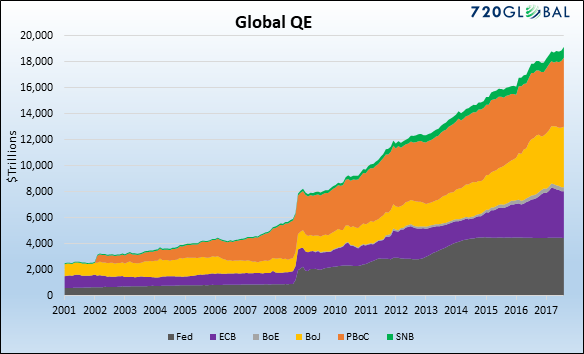
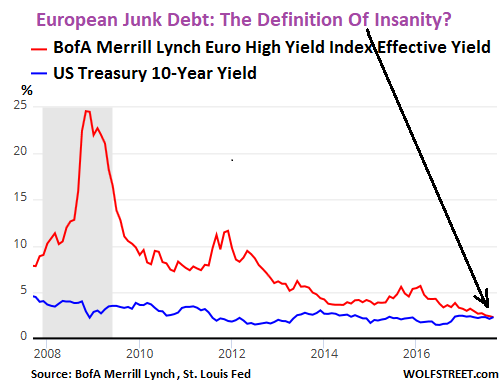
On the other hand, quantitative easing (QE) activity by the U.S. Federal Reserve, People’s Bank of China, European Central Bank and others has created a variety of implausible circumstances. The Swiss National Bank has become one of the largest shareholders in Apple (NASDAQ:AAPL) with nearly 20 million shares on its books. The Bank of Japan owns three-quarters of the Japanese exchange-traded funds (ETFs) in existence. And European corporate junk bonds yield less than comparable risk-free U.S. Treasuries.
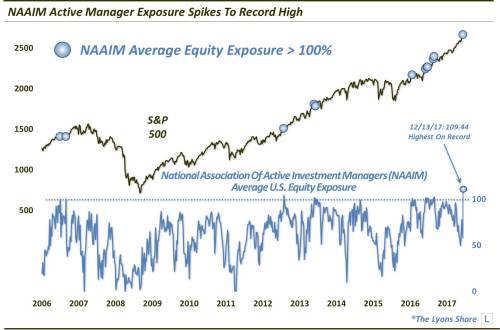
Perhaps ironically, few seem bothered by distortions and/or oddities. On the contrary. Active stock managers average 109% exposure to the asset class. That is not a misprint. The average exposure is greater than 100% such that active stock managers are “leveraged long.” The extreme reading is itself a rarity.
Retail investors are every bit as bullish as we move into 2018. According to the Michigan Consumer Survey, a record percentage of respondents expect stocks to be higher on a year-over-year basis.
Unfortunately, that may not be a good thing. More retain investors anticipate stock price increases over the next 12 months (10/2017) than they anticipated leading into the Great Recession.
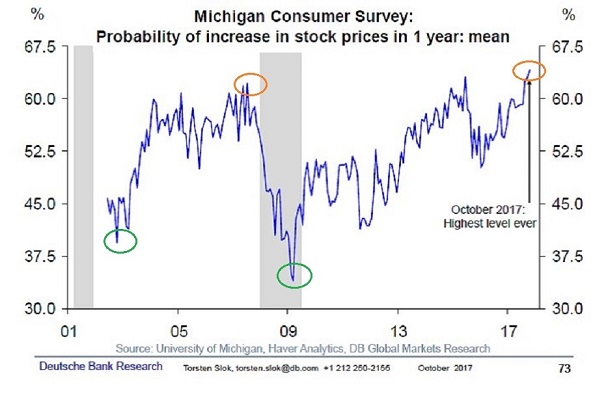
In a similar vein, consider the stock market lows following the tech wreck (2000-2002) and the financial crisis (2008-2009). The best buying opportunities occurred when investor expectations for stock growth potential were at their lowest ebb, not when survey participants were extremely optimistic.
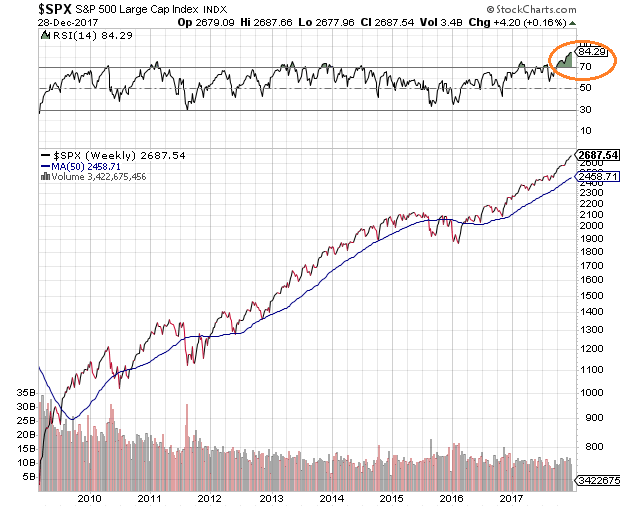
Another sign of complacency? The S&P 500 has rarely been as “overbought” as it is at the present moment. At no time in the current bull market have we seen weekly relative strength (RSI) levels as high as they are right now.
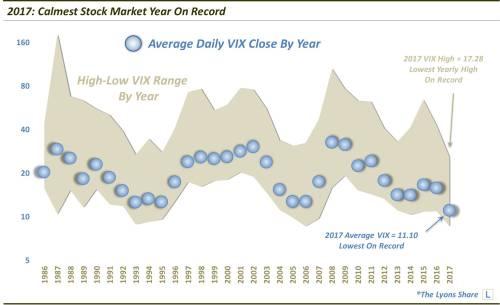
Excessive exuberance can also be seen in the absence of stock market volatility. Records have been set for the most consecutive trading days without so much as a 3% pullback or a 5% correction. It has been nearly 24 months since a run-of-the-mill 10% correction. And to the extent that the CBOE S&P 500 Volatility Index (VIX) lives up to its reputation as the “fear gauge,” the stock waters in 2017 have never been calmer.
Is the extraordinary confidence in stocks going forward warranted? Those who point to favorable trends for the economy and for earnings believe that it is. Those who see similarities to 1999 and 2007, however, favor a more cautious approach.
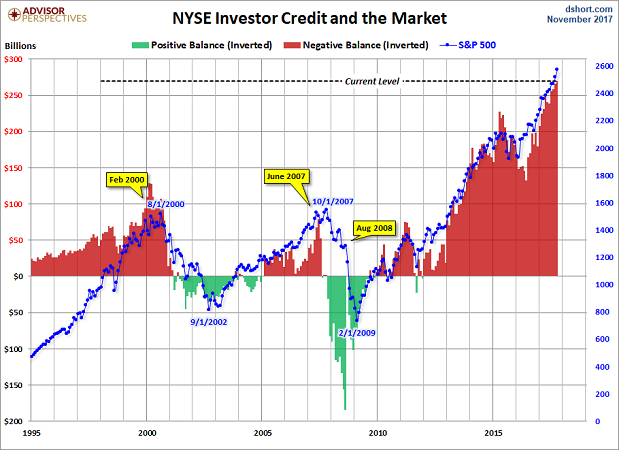
It is worth remembering that in 1999 and in 2007, like 2017, the Federal Reserve was raising rates and gross domestic product (GDP) had been improving. Similarly, in each of those years, debt and leverage had been “off the charts.” Margin debt for stocks had been hitting records in 1999 and leverage to buy real estate had been reaching never-before-seen heights in 2007. Leverage in the equity markets in 2017? Eerily reminiscent.
So what might be the proverbial tipping point? Central bank policy error. With the U.S. Federal Reserve planning to raise overnight lending rates three or four times in 2018, in addition to eliminating $420 billion from its balance sheet, the yield curve may flirt with inversion. Indeed, if the 10-year yields stays in the same general vicinity as it has since the election, and the Fed hikes two more times, the remarkably modest 50 basis point spread between “10s” and “2s” would evaporate.
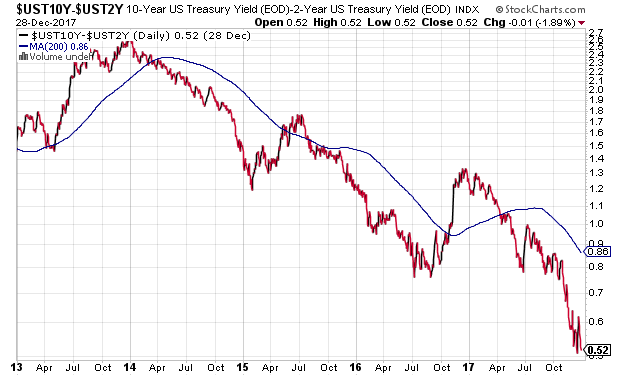
Not surprisingly, many are already discounting yield curve inversion as a bearish indicator for the economy or for stocks. According to bond guru Bill Gross, however, our entire financial system depends on longer maturities yielding more than shorter maturities. Gross recently explained, “When credit is priced such that carry can no longer be profitable at an acceptable amount of leverage/risk, then the system will stall or perhaps even tip.”
If nothing else, investors might anticipate a rockier road in the year ahead. Should you have a cash buffer for buying the next 10%-plus correction? I do. Should you consider buying assets that have been overlooked and/or beaten down? I am. Consider a zero-debt, low P/E infrastructure small-cap like Argan Inc (NYSE:AGX) or a large-cap behemoth with two years of zero price appreciation like Starbucks (NASDAQ:SBUX).
By the same token, recognize that the S&P 500 may be living on borrowed time. Think about a protection plan, whether it involves put options in an exchange-traded fund like WisdomTree CBOE S&P 500 PutWrite Strategy Fund (NYSE:PUTW) or reducing one’s equity exposure when the monthly close on the 10-month SMA falls below its trendline. Mathematically and financially speaking, few things are ever as important as losing significantly less in stock bears.
Disclosure Statement: ETF Expert is a web log (“blog”) that makes the world of ETFs easier to understand. Gary Gordon, MS, CFP is the president of Pacific Park Financial, Inc., a Registered Investment Adviser with the SEC. Gary Gordon, Pacific Park Financial, Inc., and/or its clients may hold positions in the ETFs, mutual funds, and/or any investment asset mentioned above. The commentary does not constitute individualized investment advice. The opinions offered herein are not personalized recommendations to buy, sell or hold securities. At times, issuers of exchange-traded products compensate Pacific Park Financial, Inc. or its subsidiaries for advertising at the ETF Expert website. ETF Expert content is created independently of any advertising relationship.
