Investing.com’s stocks of the week
This article was written exclusively for Investing.com
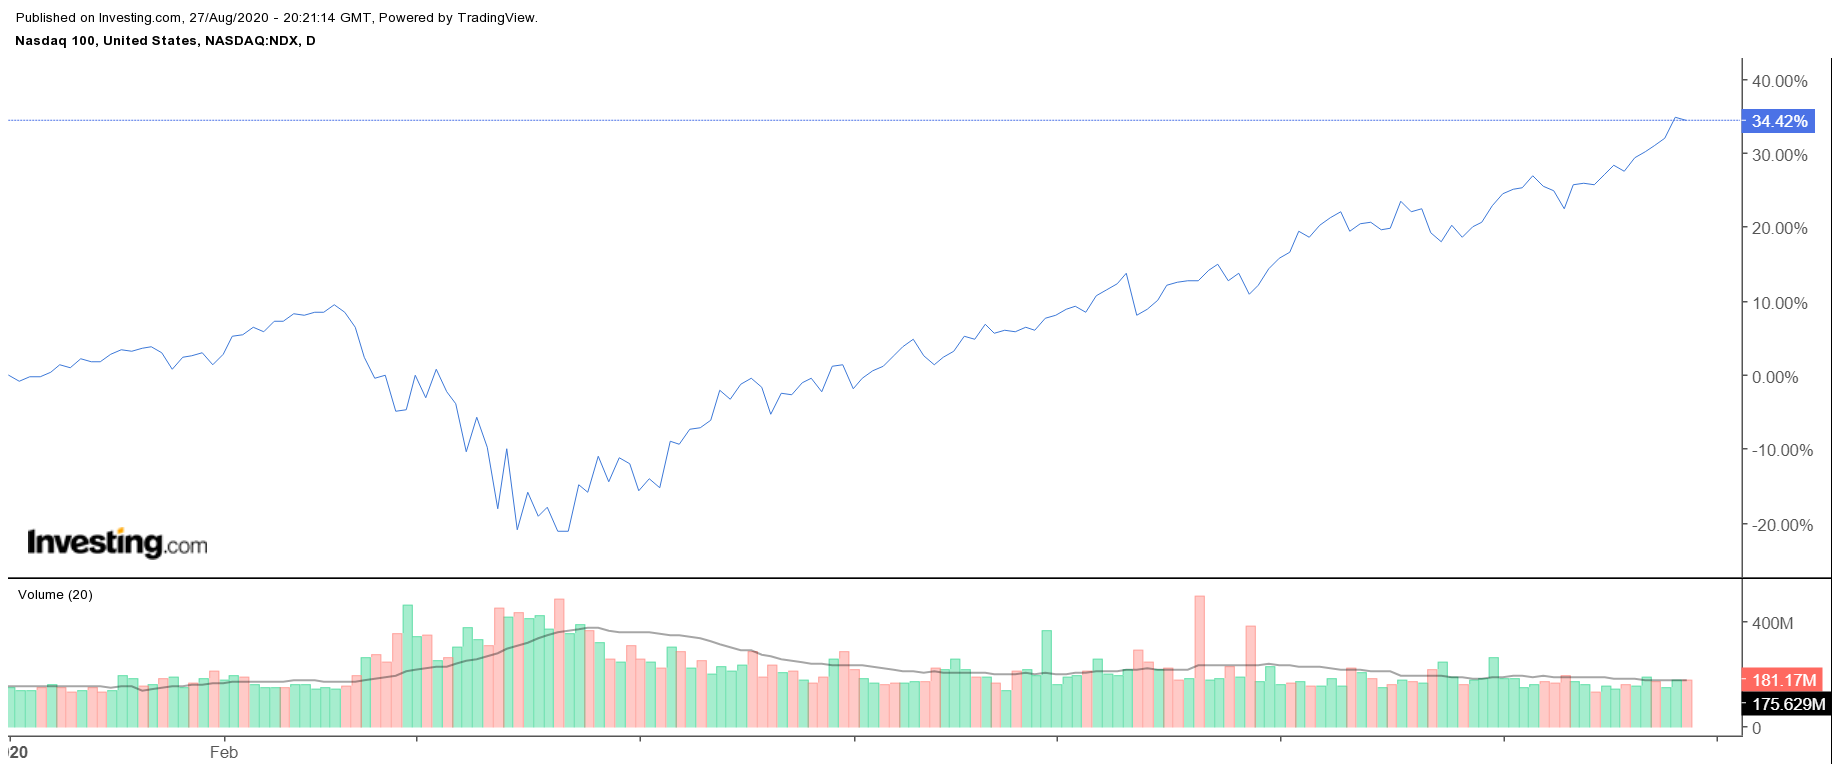
Technology stocks have seen massive gains in 2020, with the NASDAQ 100 rising by almost 35%. Indeed, shares in the sector are nearly 80% higher than their March lows.
It's a fantastic turnaround story that has led the market from a coronavirus plunge to irrational exuberance all within six months. However, the sudden turn of events has left some market participants feeling a bit nervous, leading them to hedge some of their big tech shares and at the same time, also revealing some short positions, as a way of preparing for another unexpected turn in the market.
From a technical standpoint, equity indexes are overbought and are due for a fall. The S&P 500 and NASDAQ 100 have both seen their relative strength indexes reach extreme highs. If the past has anything to say about the future, then a pullback could be just a heartbeat away.

Technology Options Trades
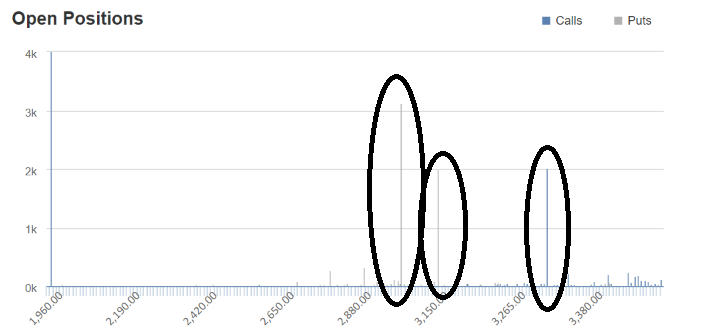
Options activity picked up in a meaningful way on August 26, with open interest levels for many of the leading technology stocks surging. To name a few, Adobe (NASDAQ:ADBE), Microsoft (NASDAQ:MSFT) and Amazon (NASDAQ:AMZN) were active for the expiration date on September 25.
The activity showed several risk reversal spread transactions taking place. It is an indication that someone is hedging long positions while revealing some short positions.
For example, it seems that someone may be short shares of Amazon and is trying to hedge this position by buying the $3,320 calls and $3,100 puts and selling the $3,155 puts, a hedge against Amazon rising. At the same time, Adobe saw its $480 calls sold, and $455 puts bought, a hedge against Adobe falling.

Volatility On The Rise
It is not only stock options that are sending clues of a potential turn lower; there are hints that volatility levels may be on the rise. In recent days, the open interest levels for the VIX January 20 27 calls have increased by roughly 100,000 contracts.
At the same time, the 40 calls for the same expiration date have risen by about 100,000 contracts too. The data shows that the 27 calls were bought for around $6.00 per contract, while the 40 calls were sold for around $3.00. It creates a spread transaction and bet that the VIX rises above 27 by January but remains below 40. That would be a sizeable increase in the VIX from its current level of around 24.
Technical Breaking Point
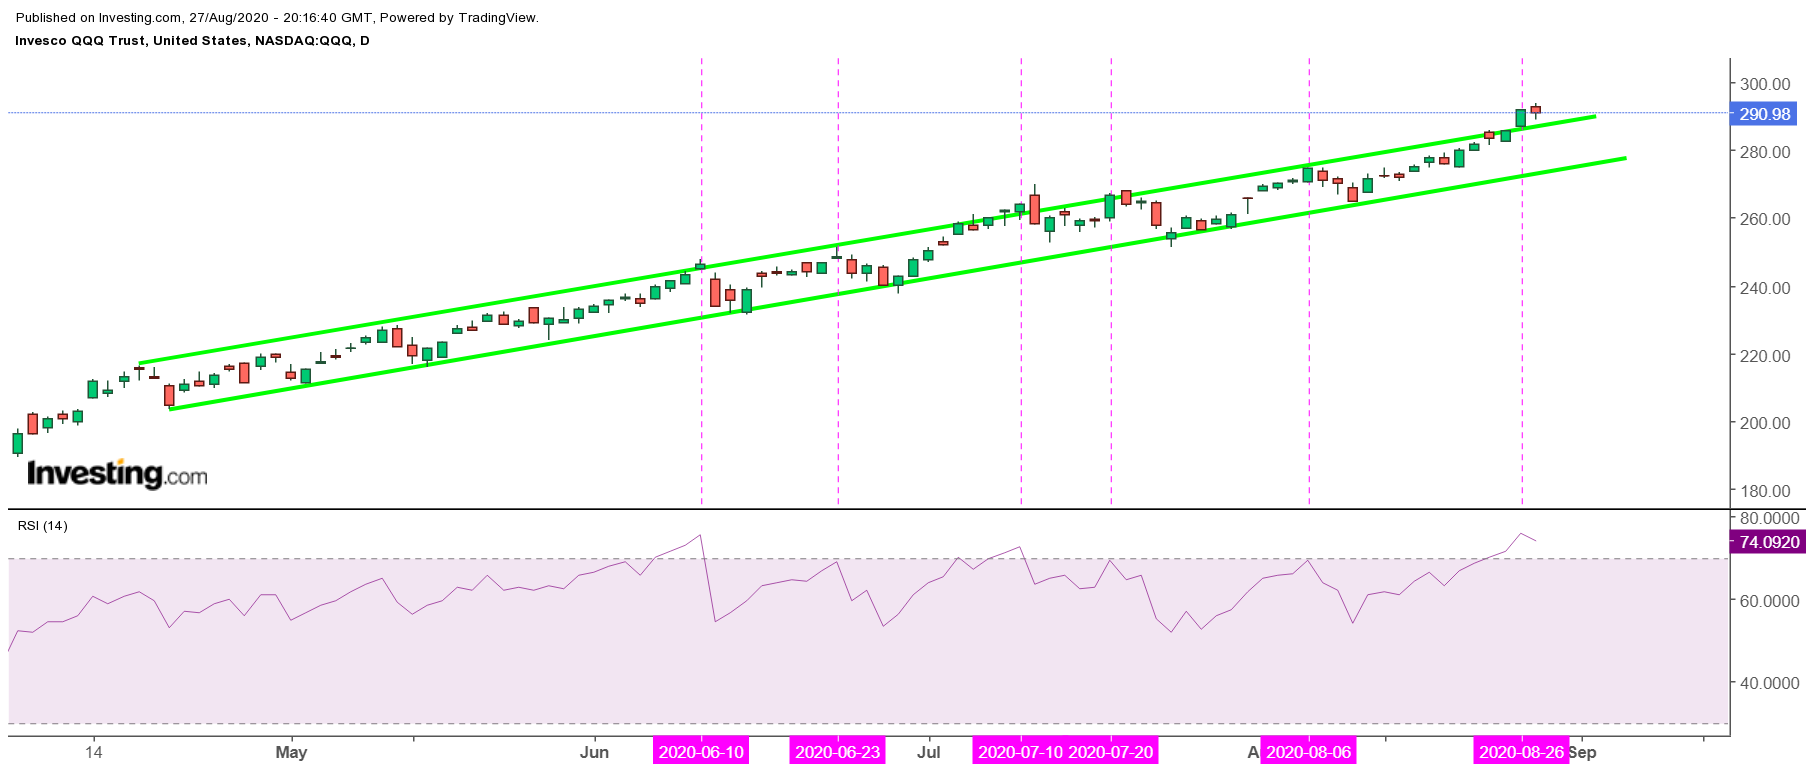
If there is a point in time where the risk is high for a market reversal, this seems to be the time and the place. The chart below shows the nearly perfect trading channel the NASDAQ 100 ETF (NASDAQ:QQQ) has been rising in since early April.
Every time the price has reached the upper bound of the trading channel along with the RSI climbing to around 70, it has resulted in a pullback to the lower end of the channel. It could result in the QQQ ETF falling to around $272 from its current price of about $291, a decline of almost 7%.
But even with that decline, the ETF would still be up tremendously on the year.

It seems that there's very little standing in the way of the equity market rising and technology stocks soaring. Whether a pullback in the market is a short or long-term event is yet to be determined.
But if the past can serve as a guide to the future, this would be the place a short-term pullback could develop.
Disclosure: Mott Capital Management, LLC is a registered investment adviser. Information presented is for educational purposes only and does not intend to make an offer or solicitation for the sale or purchase of any specific securities, investments, or investment strategies. Investments involve risk and, unless otherwise stated, are not guaranteed. Be sure to first consult with a qualified financial adviser and/or tax professional before implementing any strategy discussed herein. Upon request, the advisor will provide a list of all recommendations made during the past twelve months. Past performance is not indicative of future results.
