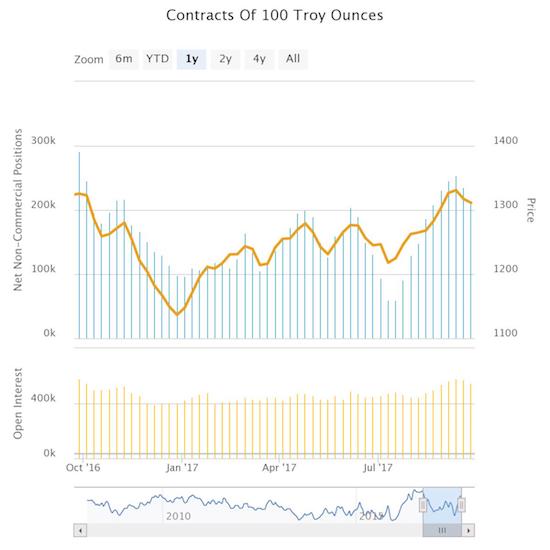
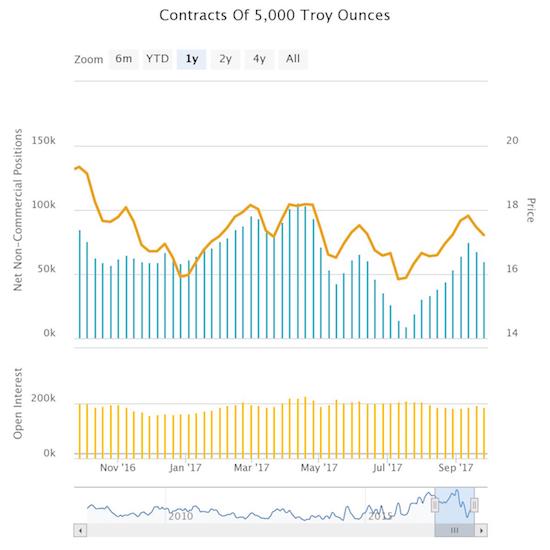
A month ago, I wrote about the near seasonal pattern of speculators accumulating net long contracts in gold and silver from July troughs to October peaks. THIS year, the speculators started up on schedule but aborted the mission as net longs peaked well ahead of October.
Speculators ended their latest accumulation of net long gold contracts in early September
Speculators ended their latest accumulation of net long gold contracts at the same time as gold speculators in early September
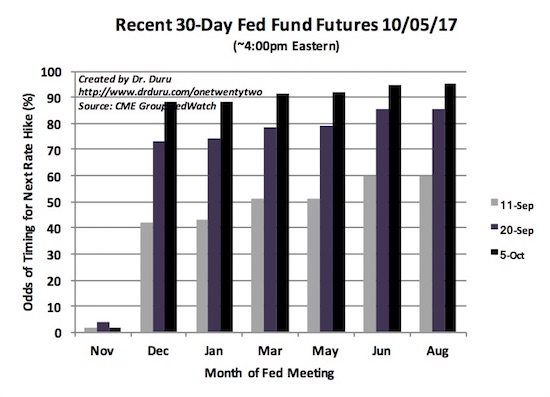
So seasonal patterns work until they don’t (granted, the month is just beginning). In THIS case, the Federal Reserve’s tightening cycle is a key differentiator. Speculators ended their run-ups ahead of the Fed’s pronouncements on monetary policy on September 20th. The market generally interpreted the resulting policy statement and accompanying press conference as freshly hawkish. The change in sentiment was so sharp that expectations for a December rate hike rushed toward “near certainty.” Just 9 days earlier, the market practically dared the Fed to wait to raise rates until March or May of next year!
Thanks to the Federal Reserve, sentiment changed sharply on the timing for the next Fed rate hike. On the day before the jobs report for September, Fed Fun Futures are near certainty for a December rate hike.
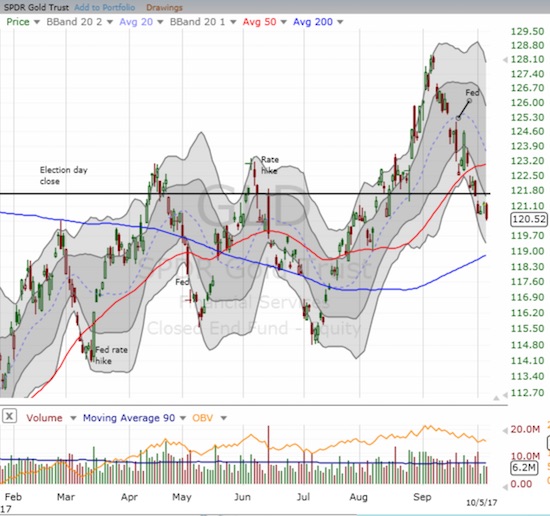
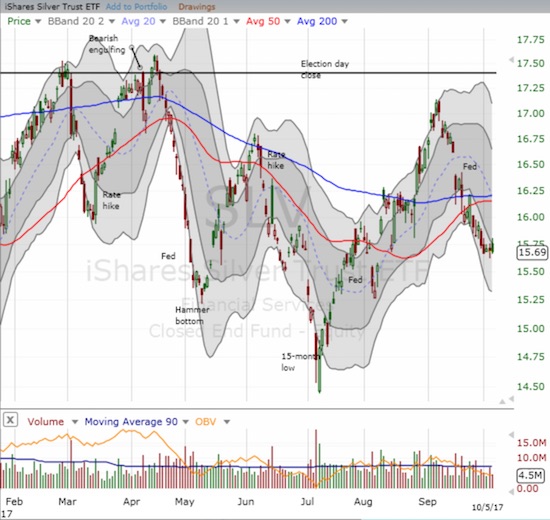
The market’s shift had a predictable impact on the price of SPDR Gold Shares (NYSE:GLD) and iShares Silver Trust (SLV): down. What started as a small pullback from a strong run-up turned into a full rout. Both GLD and SLV once again broke down below key lines of support.
The SPDR Gold Shares (GLD) sold off for most of September and broke down below 50DMA support. For October, GLD confirmed the end of its breakout above its price from the election day close.
The iShares Silver Trust (SLV) never reached resistance at its price on election day close. Instead, it sold off for most of September and broke down below 50 and 200DMA supports.
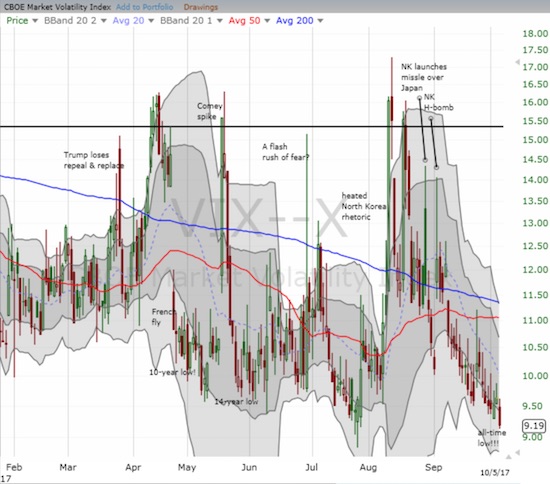
Needless to say, my last tranche of call options on SLV were unprofitable. I am tempted to load up again, but I have no immediate catalyst to motivate such a move. The volatility index, the VIX, is adding to my reluctance. While GLD and SLV sell off, the VIX is also “selling off” albeit more slowly. Today (October 5, 2017), the VIX made fresh history. The VIX reached its lowest recorded close (data available since January 2, 1990). The former all-time closing low of 9.31 was set on December 22, 1993, almost 24 years ago. After that, the next lowest close was set on July 22, 2017 at 9.36, just over 2 months ago.
The volatility index, the VIX, hit an all-time low. It is now hard to imagine or remember the dynamics that drove the VIX on earlier run-ups.
While I avoided reloaded on SLV call options, I celebrated the occasion by doubling down on my call options on ProShares Ultra VIX Short-Term Futures (NYSE:UVXY). I figure there is no better time to hedge than when complacency has reached record levels! I will continue this discussion in the next edition of “Above the 40.”
There are other important developments such as the percentage of stocks trading above their respective 40DMAs reaching heights last seen in January of this year as an extended overbought rally is well underway. In parallel, the S&P 500 (via SPDR S&P 500 (NYSE:SPY)) and the NASDAQ hit fresh all-time highs. I sold my fistful of call options on PowerShares QQQ ETF (NASDAQ:QQQ) into the rally, but I am still holding my bushel of call options on the Financial Select Sector SPDR ETF (NYSE:XLF).
Be careful out there!
Full disclosure: long GLD and SLV, long UVXY call options

