Stocks finished flat again yesterday, with the S&P 500 closing at 4,182. The index keeps testing this upper level around 4,185, and I’m not sure which way it wants to break. With volume as thin as it is, some days, it could really break either way on any given day. I’m not even going to guess which way it will break. It doesn’t change the longer-term picture: valuations are high, no matter how you look at them.
I have been saying for weeks, maybe months, that the equity risk premium in the market is at historic levels, and normalization of valuations would lead to a very sharp decline, and I don’t mean a 5% drop. I have been of the view of something closer to 3,200 3,400. I’m not the only one who thinks this way. Mike Wilson of Morgan Stanley (NYSE:MS) recently came out with the same view as me. So I’m in good company.
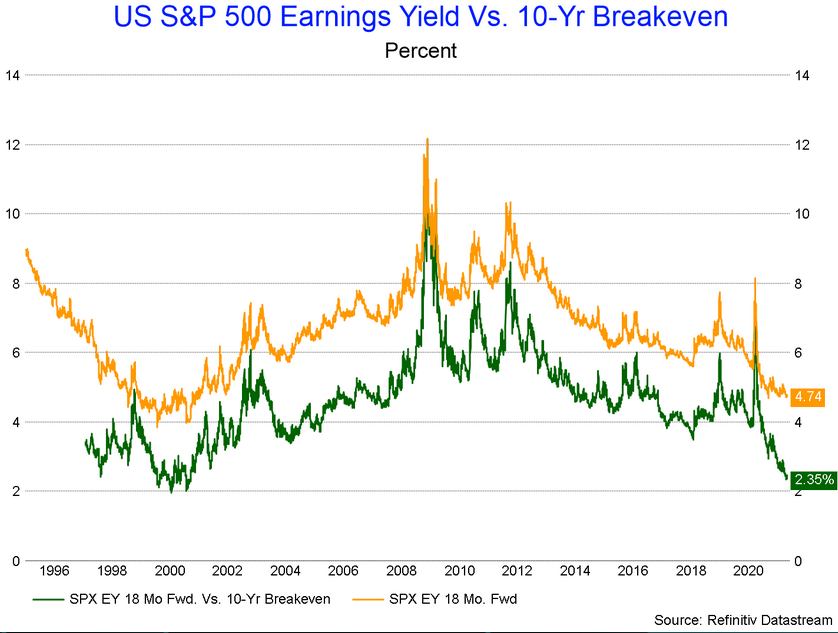
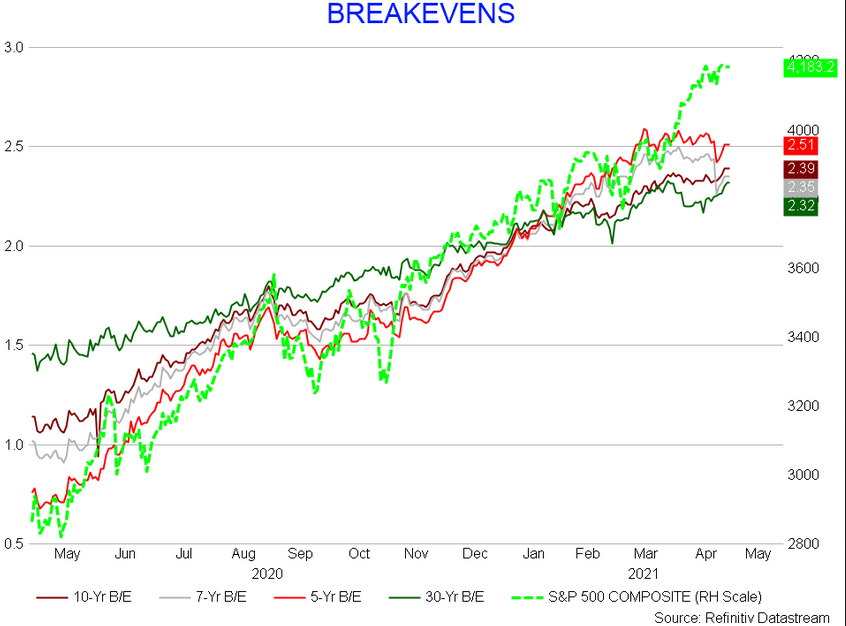
The Fed is screaming about getting higher inflation expectations, and to some degree, they are halfway there. Breakeven inflation expectations have been over 2% since December. The S&P 500 has been chasing these inflation expectations higher for months, but you can see the recent detachment. So did the correlation break? Or is the S&P 500 about to break down? I have a feeling we will soon find out.
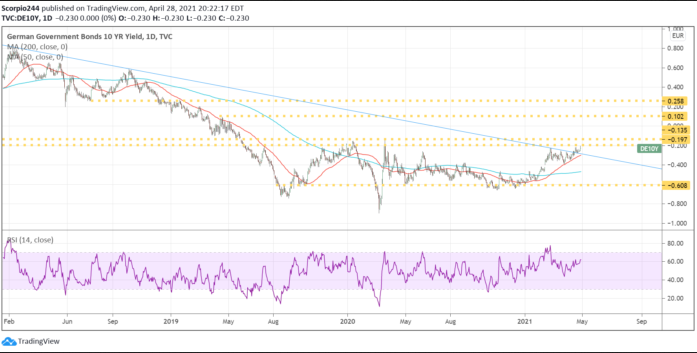
The problem for the Fed is that rising rates are not only a US thing; it is a global thing. Rates are breaking out everywhere. The German 10-year is on the cusp of a massive breakout. It is why the dollar has been sinking; the rate spread has been contracting again.
Apple
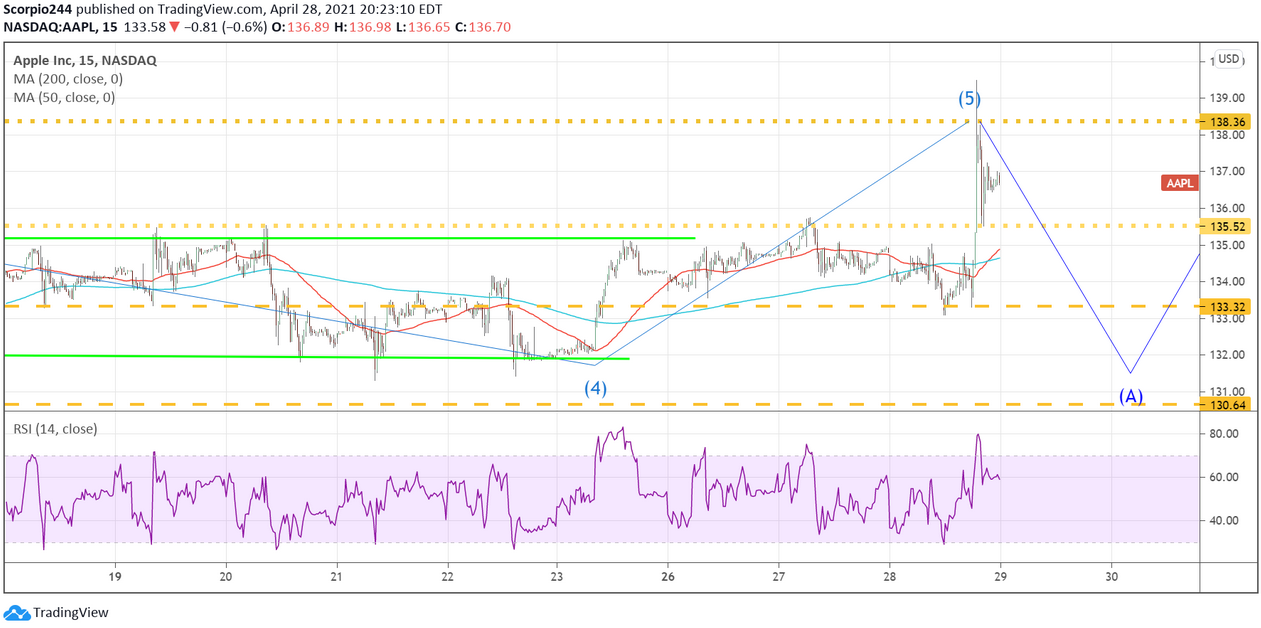
Apple (NASDAQ:AAPL) reported better than expected results, no surprise given the push higher into the print. I said the stock could rally to as high as $138 and then sell off if the company gave no guidance. They gave no more guidance than they gave last quarter. I think it will result in the same thing happening, with the stock selling off tomorrow. For a stock that beat earnings and revenue by the margin it did, the equity should have been up more than a measly 2%.
AMD
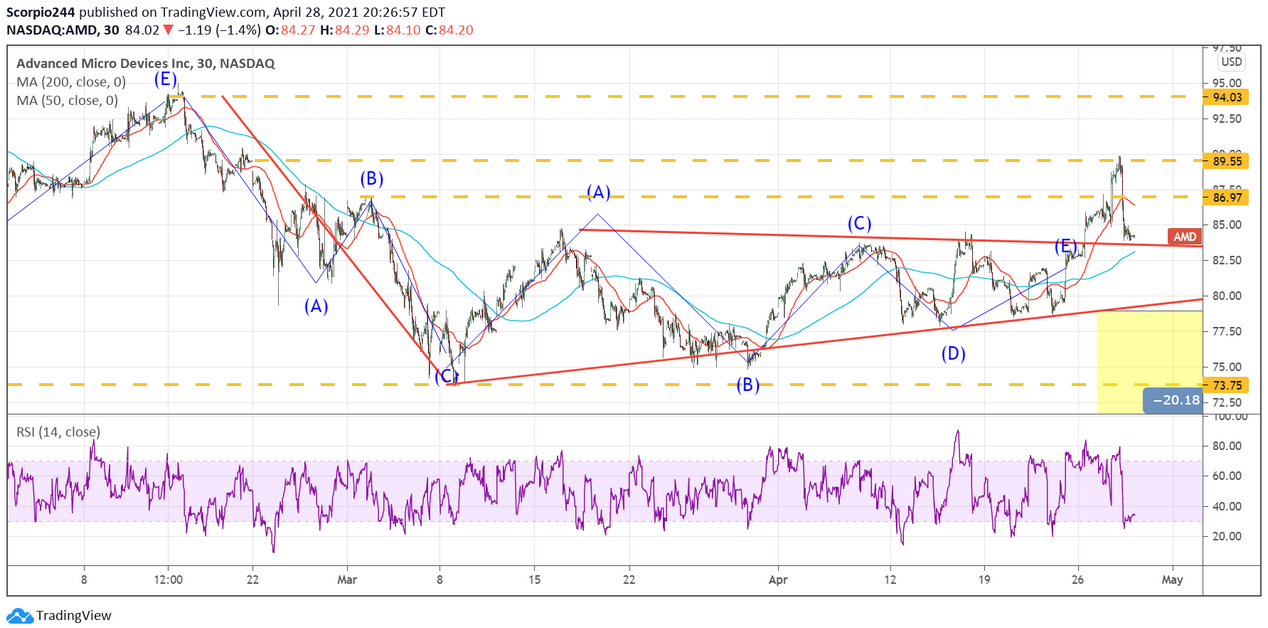
Look at Advanced Micro Devices (NASDAQ:AMD); the company reported good revenue, good earnings, great guidance. The margins were the disappointment. They gapped the stock higher, filled the gap at $90, and sold it off. I think the Xilinx (NASDAQ:XLNX) deal keeps this thing from going anywhere but down.
Amazon
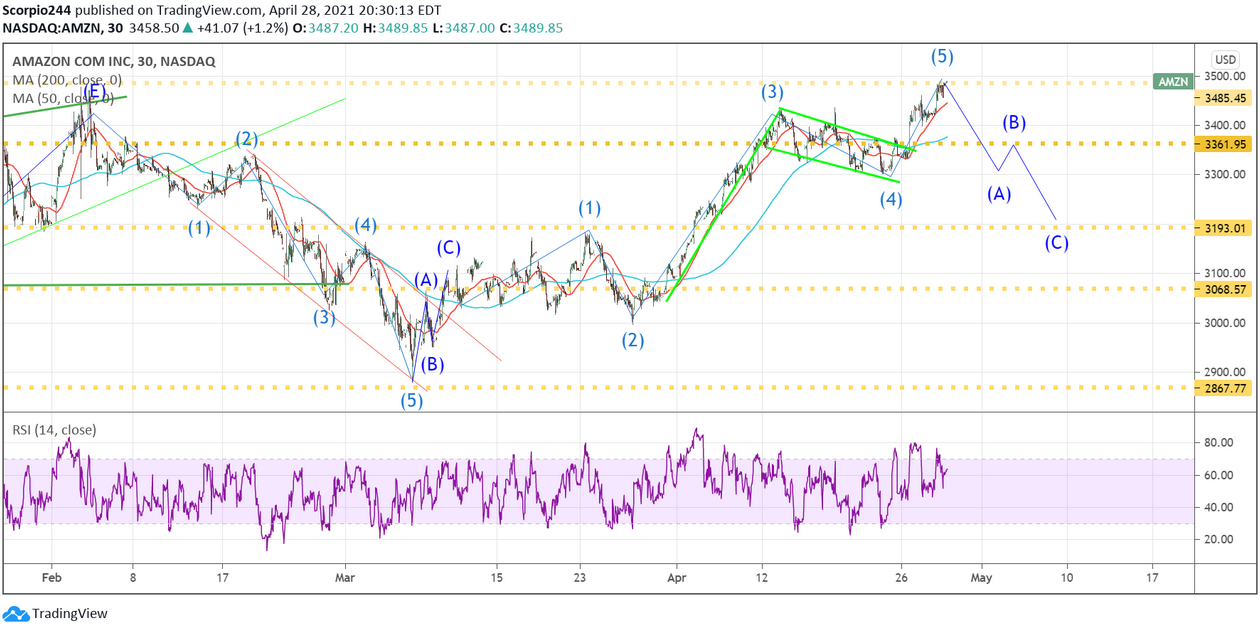
Imagine what they will do to Amazon (NASDAQ:AMZN) if AWS disappoints. Look at what happened to Microsoft (NASDAQ:MSFT). Like I said, the only thing I could find that looked bad for Microsoft was Azure which was at 46% in constant currency, missing the 50% mark; otherwise, it was a great quarter with great guidance. If AWS misses or that operating income misses, watch out. A blowout on earnings won’t be enough because everyone knows the bulk of operating incomes comes from AWS.
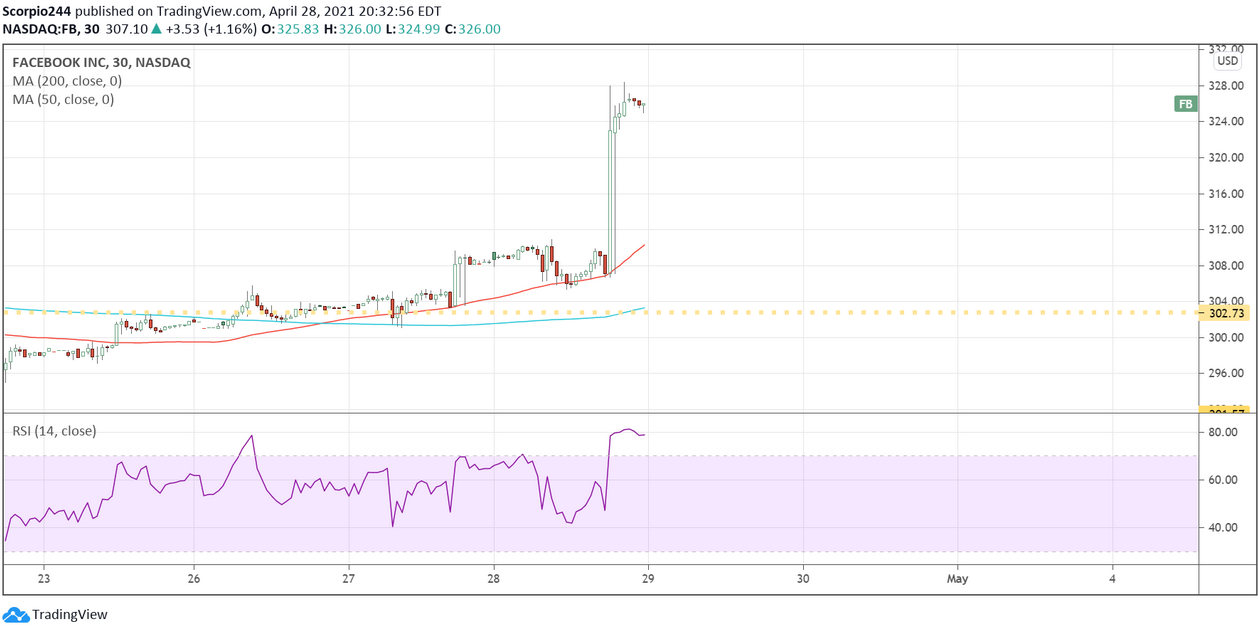
I’ll be really impressed if Facebook (NASDAQ:FB) keeps these gains today. Sure the quarter was great, but did you read the press release? They are telling you that this may be the best it will be for a while: lapping growth, more ad headwinds. We will see tomorrow.
