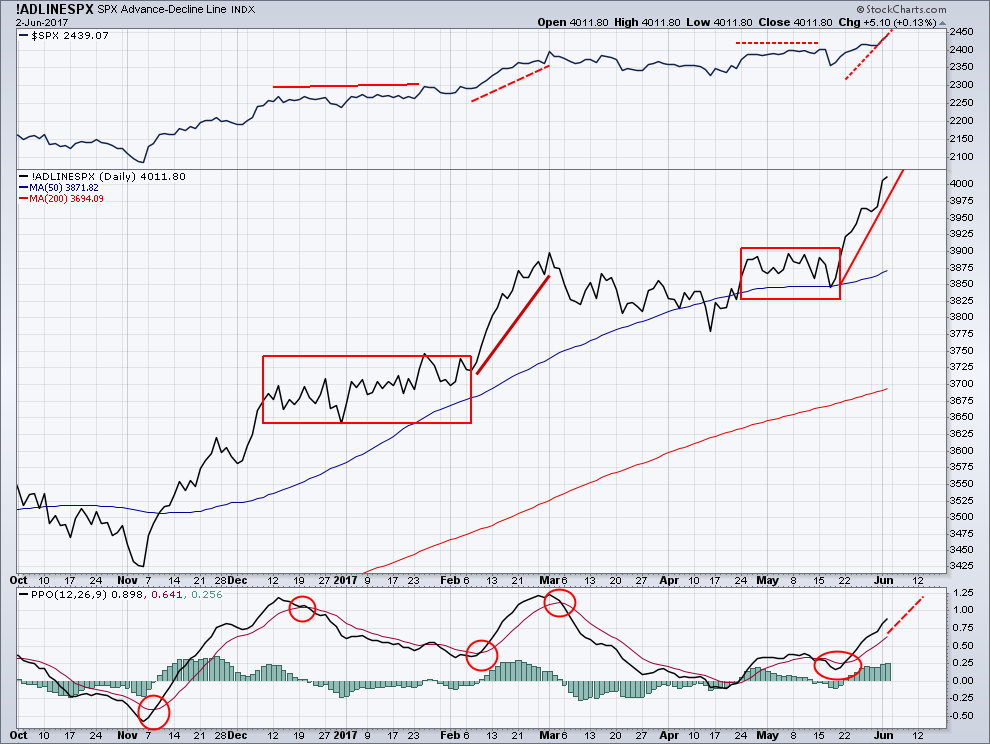
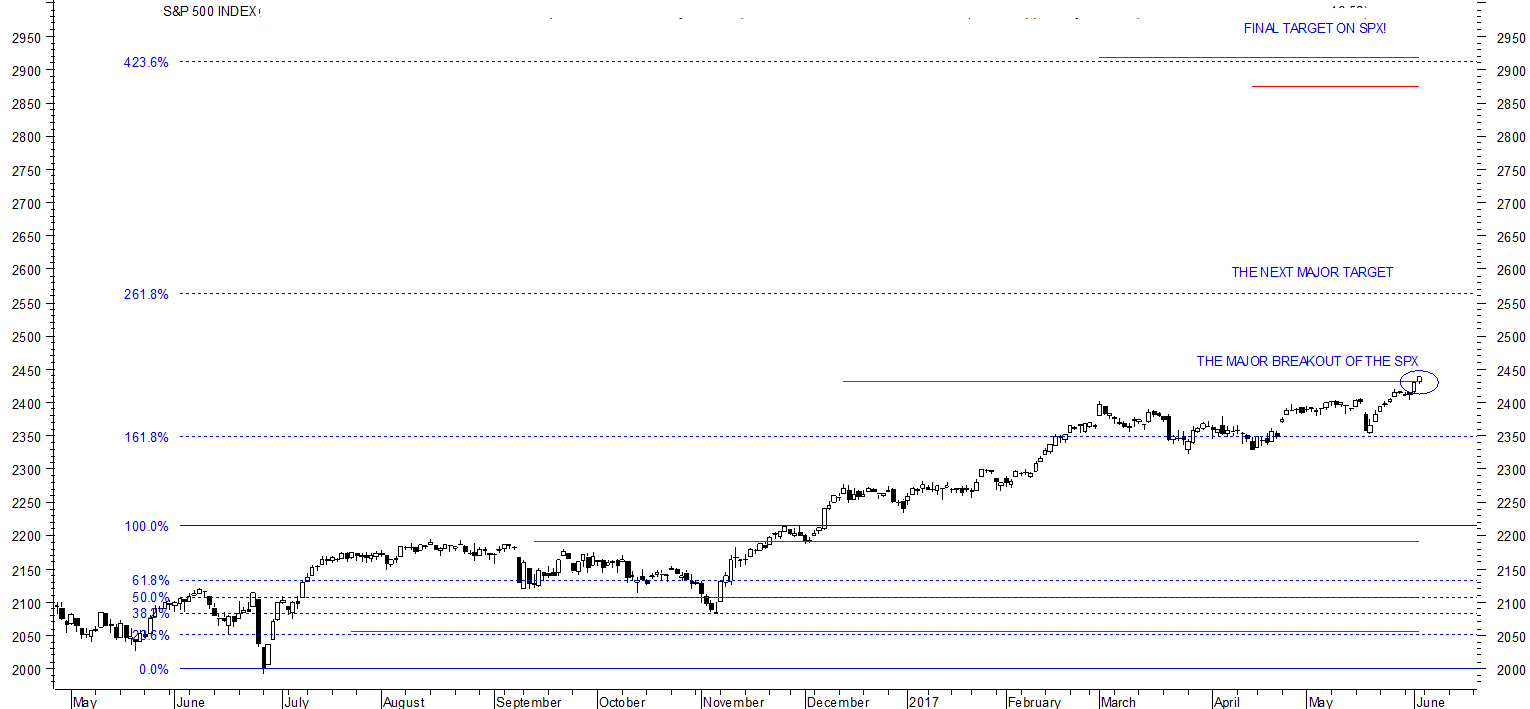
U.S. stock markets just keep going higher and higher! How much higher will they go? I am forecasting another 25% higher for U.S. stocks! The ‘bullish trend’ from the breakout continues, as expected. Breadth has become strong, once again, including a new all-time high on the SPX Advance/Decline line to match the new all-time high for the SPX. My breath thrust index reissued another buy for the SPX on May 31st, 2017. Once the markets wake up and realize that there will be no U.S. tradewars, they will then begin their assent.
THE BIG PICTURE
The Fourth Industrial Revolution, which will be referred to as ‘Tech Hypergrowth’, will be the enabling attribute of technology’s new central role within the global economy. Through technological innovation and investment, in developing infrastructures, companies are heading into an all new frontier.
Harnessing technology so as to realize undeveloped opportunities is a hallmark of ‘tech hypergrowth’. This approach leads to the now quite familiar phenomenon of innovation. Tech Hypergrowth Companies are employing both existing and recently developed infrastructures for growth. These new opportunities lie in ongoing and recent technology shifts, industry transformations and demographic and societal changes. Research indicates that ‘tech hypergrowth’ companies are highly data-driven and that data is enabled to adjust the fit between the technology, the business and its’ customers.
‘Emergency Stimulus’ Is Now Permanent
Last Friday, June 2nd, 2017’s Jobs Report supported the number of new jobs that are now expected. If the economy continues to contract, the Fed, in alliance with the Trump Administration, will increase their money printing which will, in turn, push gold higher.
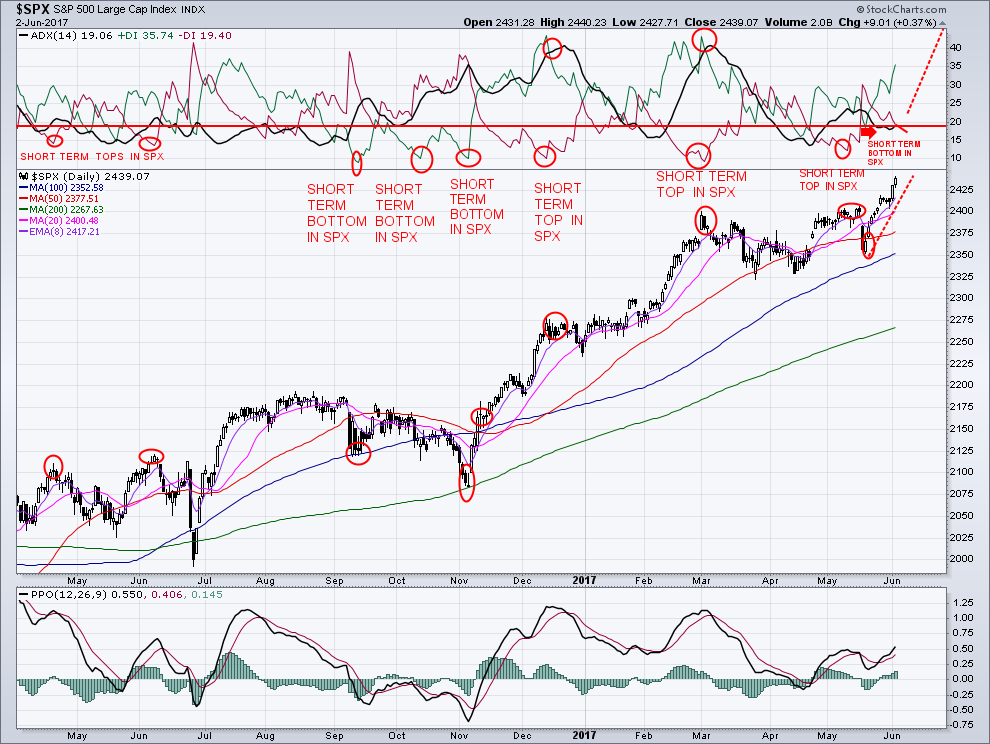
This explains why gold prices rallied in response to the disappointing jobs report. There is no market crash on the horizon. In last weeks’ article, May 26th, 2017, I wrote (that) “When short-term sentiment becomes pessimistic, it creates a new entry signal to re-enter the SPX long. This is exactly what occurred on May 25th, 2017”.
We still remain extremely bullish with a stop/loss at 2400. There is major support at the 2400 level. This level used to be strong resistance, then became major support in the May 2017 breakout.
Historically, the best sectors were dominated by staples, utilities and health care which had shown consistent positive returns.
Understanding correlations in complex financial systems is crucial in the face of turbulence, such as the continuing ongoing ‘financial crisis’. The strong breath and new highs support the advance of the SPX as it continues on its’ gains.
The New Bear Market Of Interest Rates
In recent decades, this has led to a further decline in interest rates, almost every time, along with a rally in the more defensive sectors of the stock market.
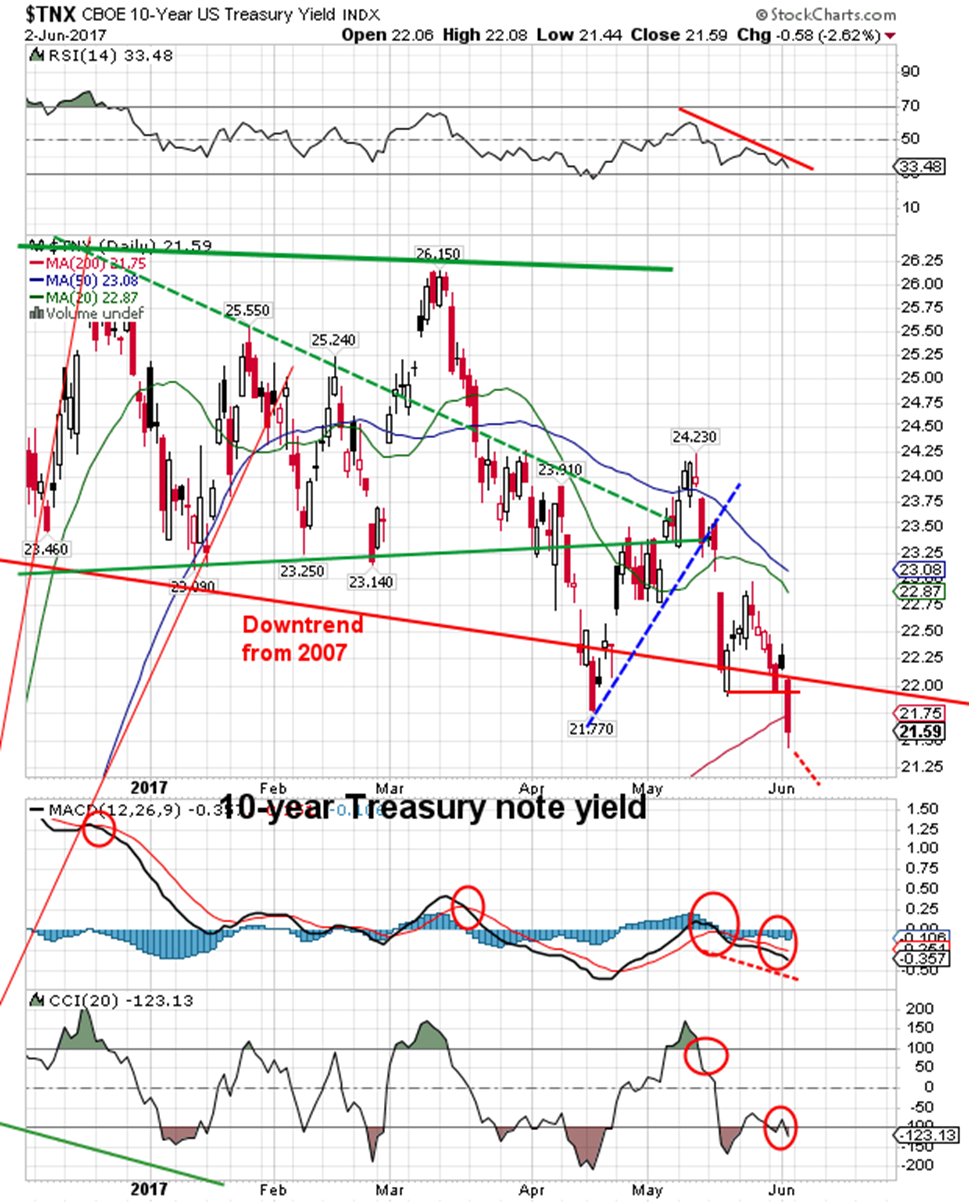
Over the past 36 years, the ten-year Treasury Note Yield has preceded a new downtrend in interest rates, virtually every time,when they have reached major support. Yields dropped an average of a 11% over the following year and declined 9 out of 11 times.
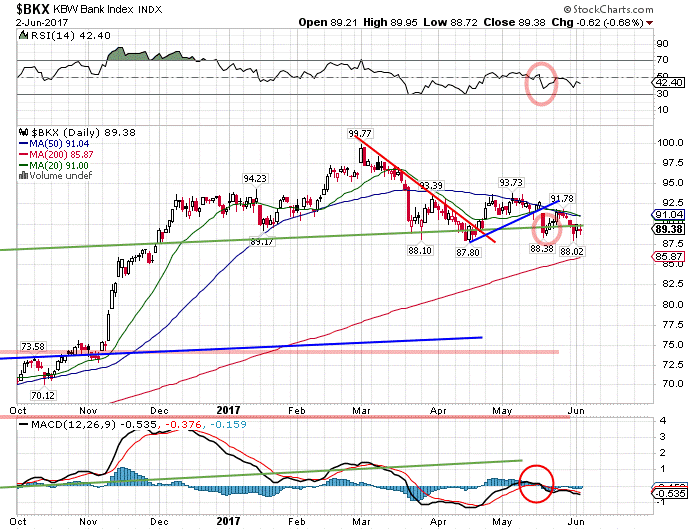
As interest rates continue to decline, it is great for bond funds, but not good for banks. The SPDR S&P Bank (NYSE:KBE) is near its 2017 low as depicted in the chart below.
The U.S. dollar index closed last week at a new low for the move at 96.67, down 47 basis points on Friday, June 2nd, 2017 (0.48%). The dollar's trouble came when the government jobs report announced only 138,000 new jobs were created last month. This fell short of economists' expectations and lower than that of April of 2017. Dropping yields are a driver of currency exchange rates and forecast future lower interest rates.
The U.S. dollar clearly took a hit from the May jobs report with expectations of the Fed raising U.S. interest rates beyond June. From a technical standpoint, the Dollar Index is bearish on the daily charts. With the lack of confidence that the Fed will not take any action beyond June, the dollar has been pushed further into a new bear market territory but price is nearing critical support and I do feel a short term bounce in dollar is near.
The Decoupling Of Correlated Asset Classes
In financial systems, correlations are not constant, all the time, but rather, vary over time. Reliable estimates of correlations are necessary to protect a portfolio. I find that the result that the correlation among different ‘asset classes’ scales ‘linearly decouple’ with market stress.
Consequently, the diversification effect, which should protect, melts away in our current financial times. My empirical analysis is consistent with the interesting possibility that one could anticipate diversification breakdowns.
In our very leveraged financial markets, the ‘leverage effect’ can decouple the traditional relationships correlation between the asset classes.
It is crucial to understand the fundamentals of the capital processes that are currently in play. President Trump is preparing for a major shake-up at the Fed. There are three vacancies coming up at the Fed's Board of Governors. President Trump is preparing for a series of new appointments to the Fed. He is considering a former Federal Reserve Economist, who advocates the implementation of negative interest rates. The administration has been saying that it plans to deregulate the old rules that were imposed on Wall Street in the aftermath of “The Great Financial Crash of 2007”.
In January 2018, the term of Fed Chairwoman Janet Yellen will expire. The president is undecided whether he will reappoint her or seek a new appointee for this position.
In my opinion, President Trump wants a weaker dollar which in return will boost profits in U.S. corporation.
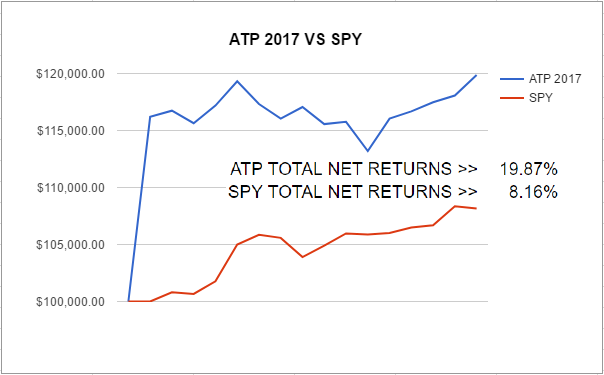
TRADES IN MAY:
Amicus Therapeutics Inc (NASDAQ:FOLD), up 18% in 6 Weeks
Direxion Daily Small Cap Bull 3X Shares (NYSE:TNA), up 5.9% in 11 Days
Direxion Daily Energy Bear 3X Shares (NYSE:ERY), up 4.75% in 2 Days
iShares Silver (NYSE:SLV), up 3.2% in 5 Days
Mobileiron (NASDAQ:MOBL), up 15% in 7 Days
FOLD, up 9.5% in 40 Days
Direxion Daily Gold Miners Bull 3X Shares (NYSE:NUGT), up 81% in 27 Days
VelocityShares 3x Long Natural Gas linked to S&P GSCI Natural Gas Excess Return (NYSE:UGAZ), up 74% in 14 Days
