Recent news regarding Moody’s credit downgrades in China will likely continue to roil the global markets and present multiple unique opportunities for strategic investors. As debt concerns grow throughout some areas of Asia and new US policy efforts shake up some common perceptions, a shift in capital is likely to occur over the next few months.
Today, I read about massive layoffs in India’s technology sector as a reaction to decreasing engagement of foreign IT services/support is a result of President Trump’s policies. When we take this news in combination with Moody’s credit downgrades for China and the fact that almost all of South East Asia is interconnected in terms of economy and trade, we begin to see a picture that is fairly clear in terms of transitional economic shifts.
If India and a portion of South East Asia suffer a technology driven economic contraction as a result of US policy shifts, how can we evaluate the approximately $900+ billion economic shift that may be unfolding. As this unfolds, unemployment, consumer spending and growth rates will differ vastly from projected levels. A minor 2~3% decrease in business activity for the Asian technology sector may have massive results if it persists over a longer term period of time (say 3~7+ years). This is exactly why we, as investors, need to be aware of these economic shifts and be able to profit from these moves.
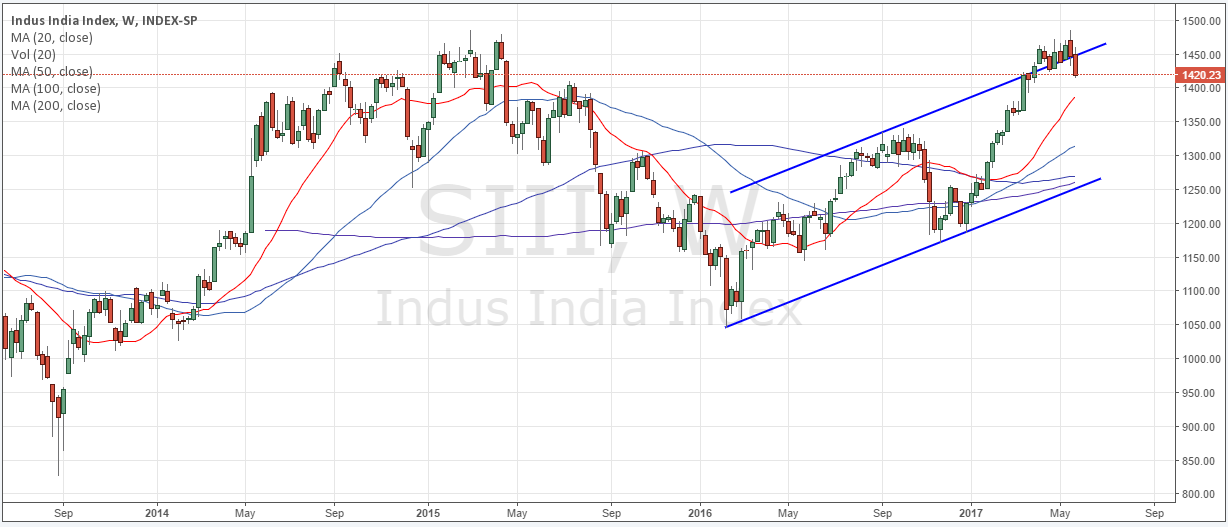
SIII (Indian Index)
The SIII has already rotated nearly 2% over the past two months from a near perfect Double-Top. The potential for a 10~20% market correction is rather strong knowing that massive layoffs in India will put further pressure on economic growth, consumer spending and economic outlook.

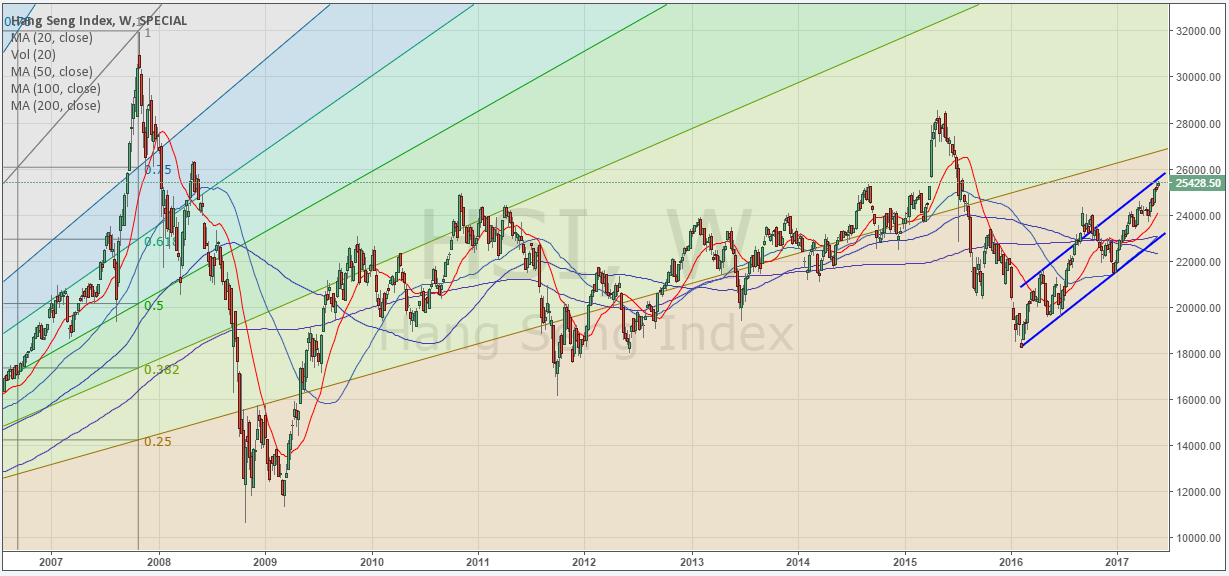
HSI (HangSeng Index)
The HSI is not showing signs of any market corrections yet. This is likely due to the fact that China is currently experiencing a technology/stock market bubble effect as a result of recent wealth creation. I would expect that any extended contraction in the bulk of South East Asia will also be seen and felt in China.

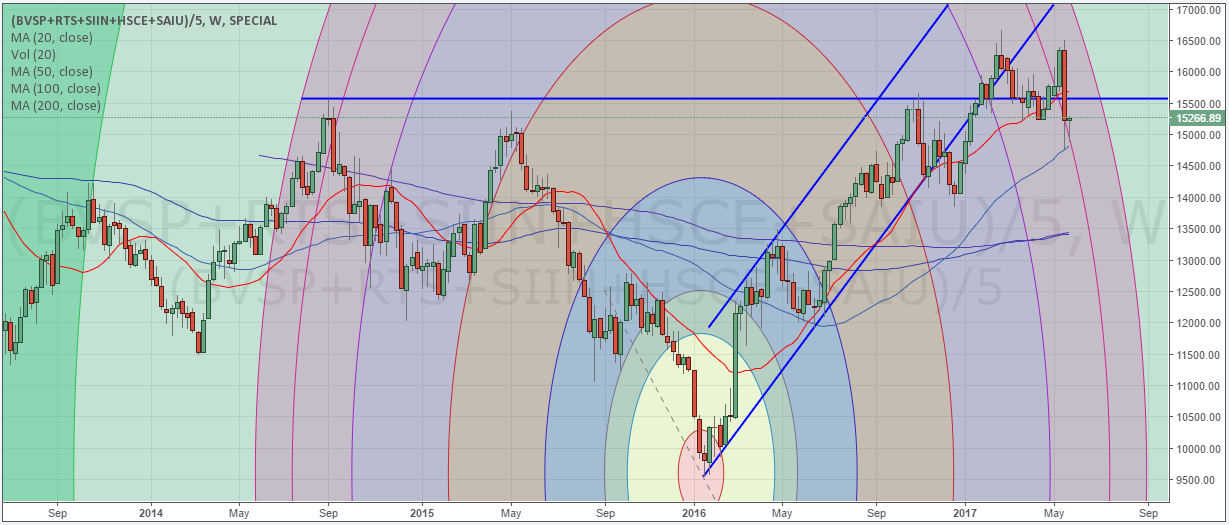
Custom BRICs Index
A custom BRICs Index shows a more defined price rotation and a clear series of lower high and lower low price trends. This would indicate that that the BRICs economies may have quite a large range of price volatility going forward with a potential for a 20~30% decline over the next few months.

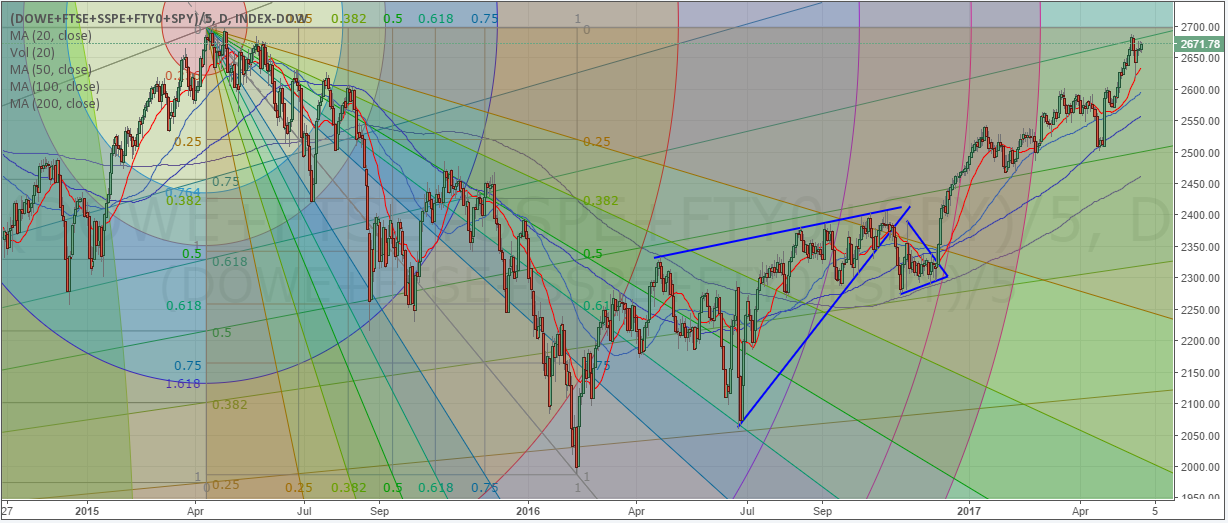
US/EU Custom Index
As this potential economic shift plays out, I suspect the US and European market will see a dramatic influx of capital investment and renewed economic activity. This chart of a custom index of US and EU indexes clearly shows the strength of these markets in relation to the economic shift that has been transacting. It is clear to see that shortly after the US Presidential elections (Nov 8th, 2017), this index has shot up 15%+ and has begun to retest 2015 highs. Could this be a massive double top to form later this year? It’s very possible.

Watch for this economic shift to continue to play out over the next 6~12+ months and watch for unique opportunities that will be presented by these moves.
TRADES THIS MONTH:
Direxion Daily Energy Bear 3X Shares (NYSE:ERY) 4.75%, in 2 Days
iShares Silver (NYSE:SLV) 3.2%, in 6 Days
Mobileiron (NASDAQ:MOBL) 15%, in 7 Days
Amicus Therapeutics Inc (NASDAQ:FOLD) 9.5% in 40 Days
