Medium-Term Technicals SOXX


Key Levels (1 to 3 months)
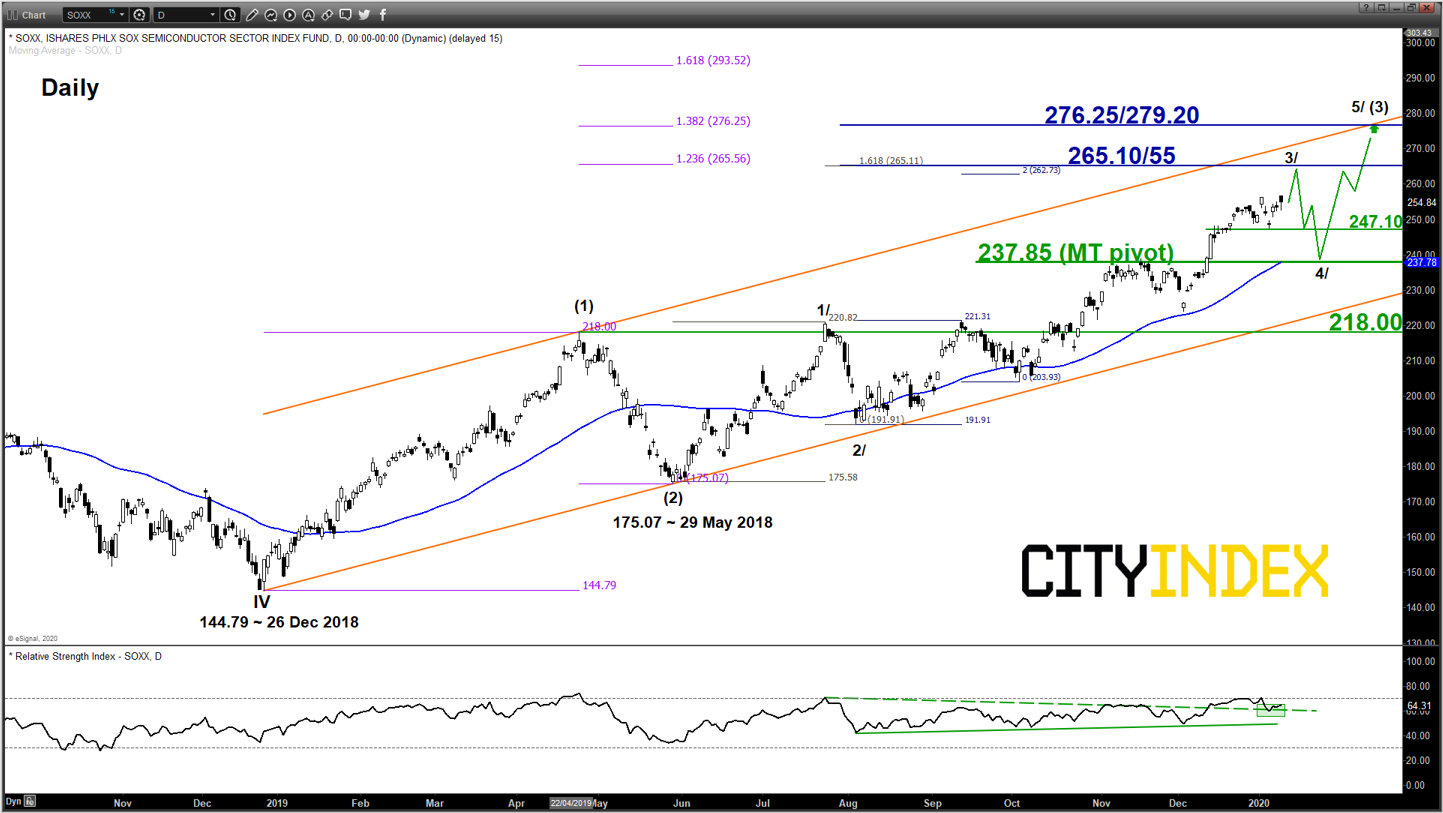
Intermediate support: 247.10
Pivot (key support): 237.85
Resistances: 265.10/55 & 276.25/279.20
Next support: 218.00 (major)
Directional Bias (1 to 3 months)
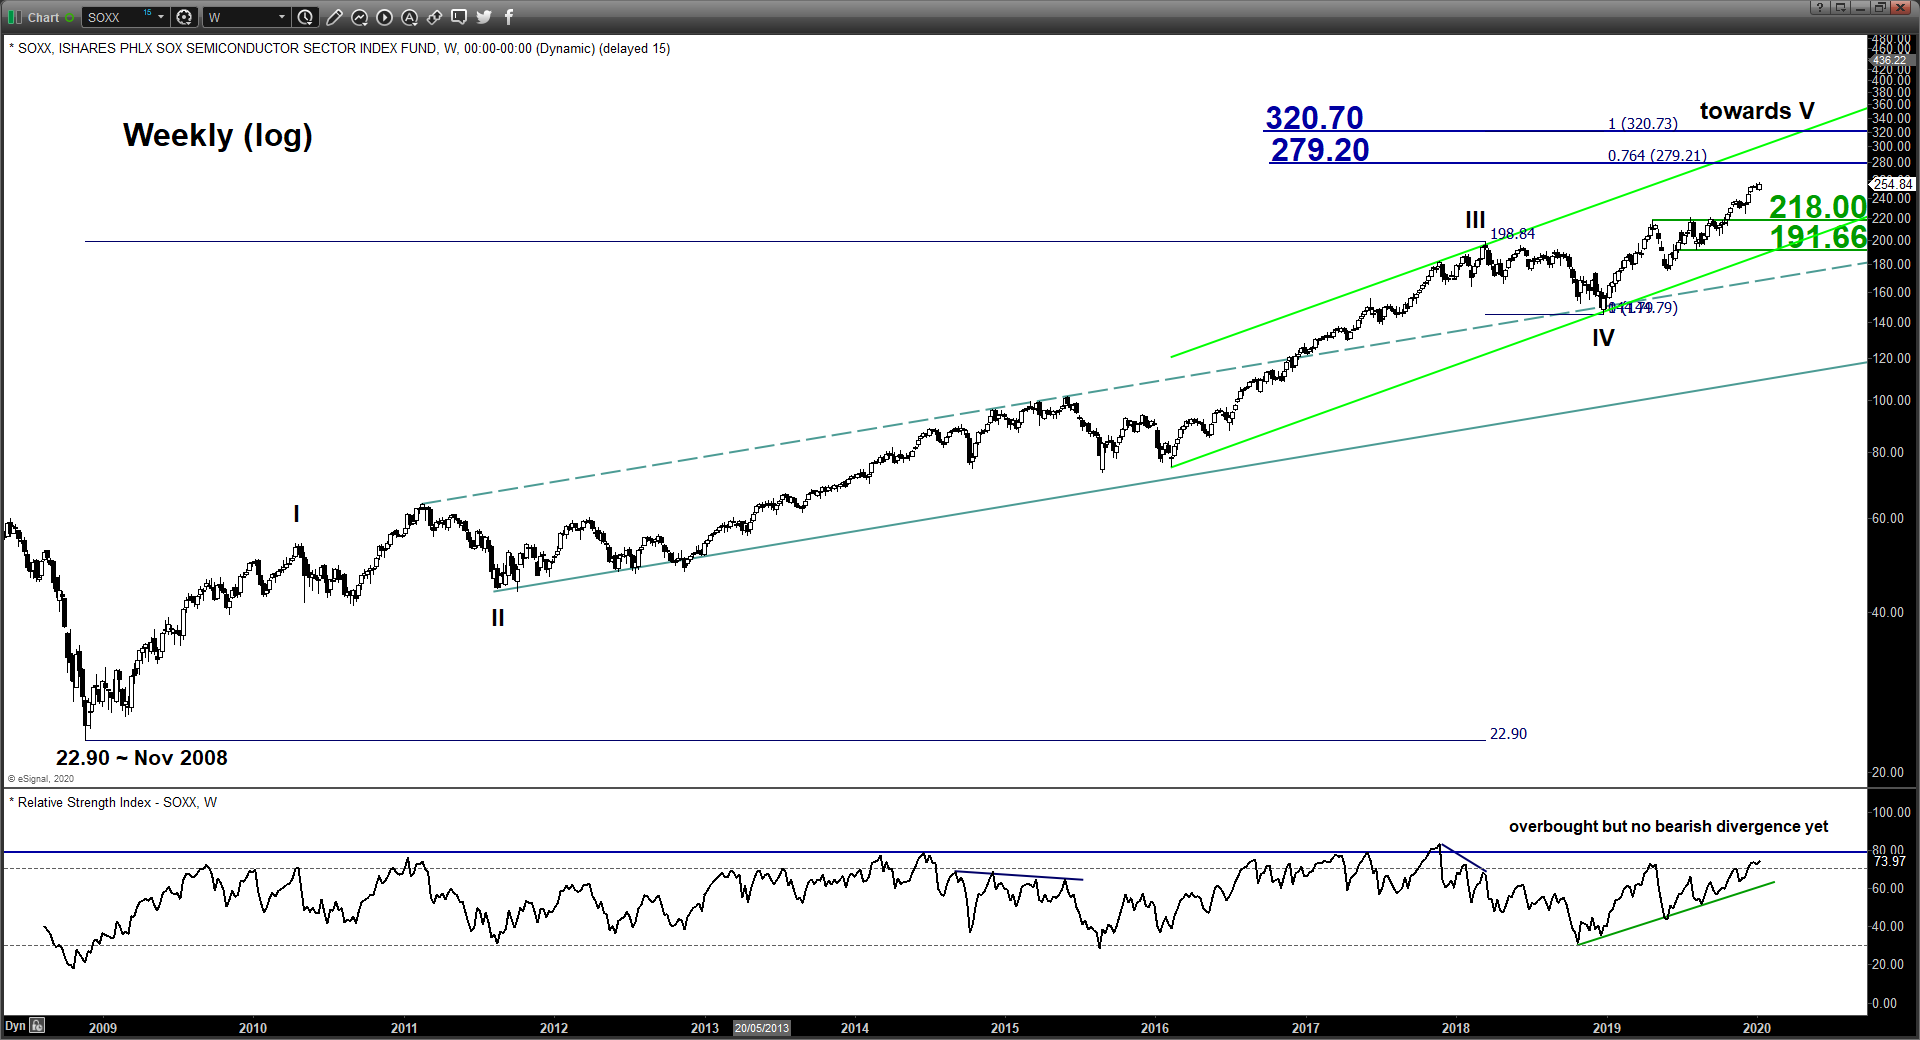
The major uptrend of the PHLX Semiconductor ETF (NASDAQ:SOXX) has been in place since the Dec. 26, 2018 low of 144.79. Right now, with U.S.-Iran skirmish on the back burner, and the focus will now turn towards U.S.-China diplomatic trade relations.
China has confirmed that Vice Premier Liu He, the top trade negotiator/special envoy will be heading to the U.S. on Jan. 13 to sign-off on the official Phase One trade deal in the White House on Jan. 15.
Risk assets such as stocks have staged a strong move up Friday 09 Jan with all the major U.S. benchmark stock indices (S&P 500, Nasdaq 100 & DJIA) hitting more fresh all-time highs. In fact, this piece of positive news flow is not a surprise as the Phase One trade deal agreement has already been made in the “limelight” since Dec.12 2019 where the U.S. administration has agreed to the terms in principal with a suspension on a new wave of 15% U.S. tariffs on about US$160 billion of Chinese consumer goods that was scheduled to take effect on 15 Dec 2019. In return, China suspended additional tariffs on U.S. farm and automobiles products.
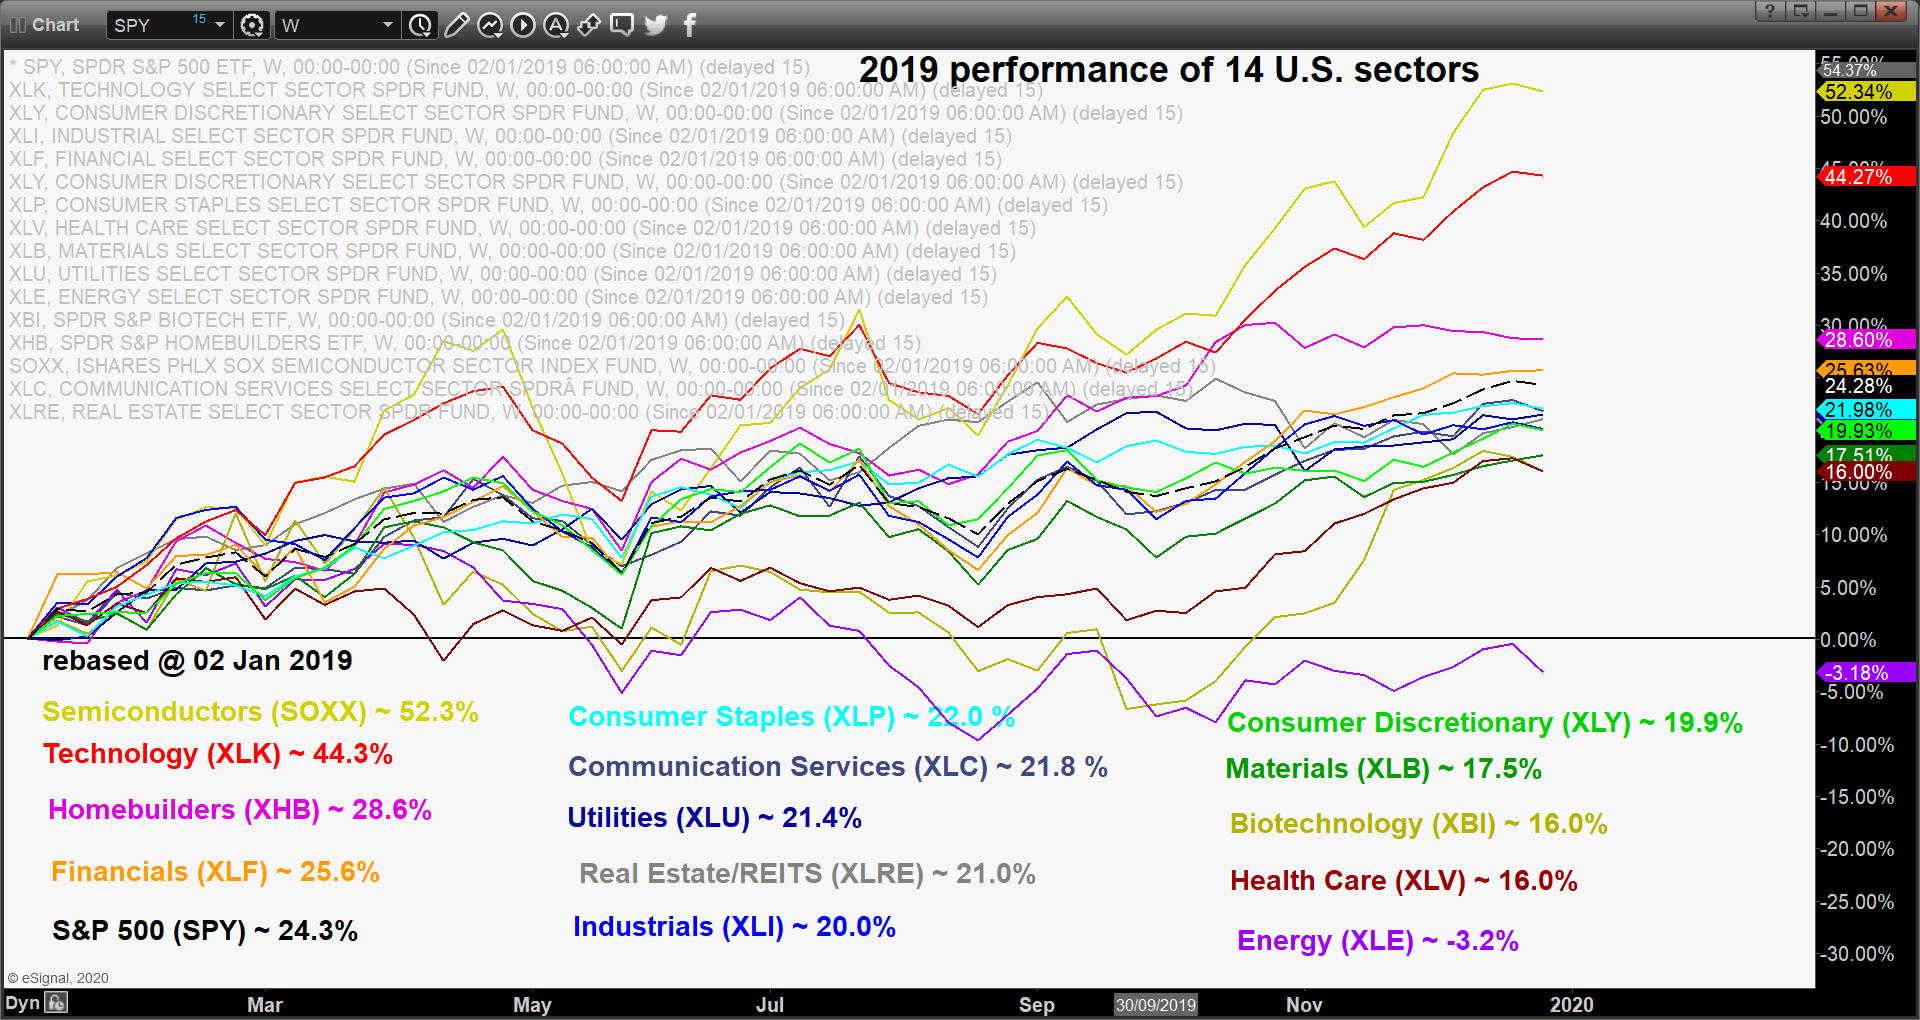
Thus, the price action of the SOXX (U.S. semiconductor sector that is a key beneficiary on a de-escalation of U.S-China trade tensions- see first chart) may continue to see a further rally to target the 265.10/55 resistance next week before a meaningful pull-back of 7% to 9% to take shape towards the key medium-term pivotal support of 237.85 as this piece of “good news” have already been “priced in” before the next potential impulsive upleg sequence materialises to target 276.25/279.20 resistance next.
On the other hand, daily close below 237.85 put the bulls on hold for deeper corrective pull-back towards the major support at 218.00 (former range resistance from 24 Apr/12 Sep 2019 & lower boundary of the ascending channel from Dec. 26 2018 low).
Key Elements
- Since its Dec. 26 2018 low, the price action of SOXX has continued to evolve within an ascending channel with upper boundary now acting as a resistance at 279.20 which also confluences with a Fibonacci expansion cluster.
- The daily RSI oscillator remains positive above its corresponding support zone but it is coming close to an extreme overbought level of 75%. These observations suggest that medium-term upside momentum is at risk of reaching overstretched condition soon and may see an imminent pull-back in price action.
- Elliot Wave/fractal analysis suggest that the Index is coming to the potential end of its intermediate degree wave 3/ bullish upleg sequence in place since 05 Aug 2019 low with a likely end target at 265.10/55 (Fibonacci expansion cluster). Therefore, it may start to see a corrective down move wave 4/ sequence unfold next.
- The 237.85 key medium-term support its defined by the former swing high area of 15 Nov 2019, Fibonacci retracement cluster and the 55-day Moving Average that has saw significant price reactions on it in the past since 03 Dec 2018.
