The Conference Board reported the LEIs and CEIs this week: LEIs increased .6% while CEIs rose .2%. The only negative LEI component was the ISM manufacturing new orders index, which subtracted .05% from the total number. But two other leading manufacturing numbers were positive. Perhaps best of all, the average workweek of production workers added to the number. Three of four CEI components expanded; only industrial production contracted.
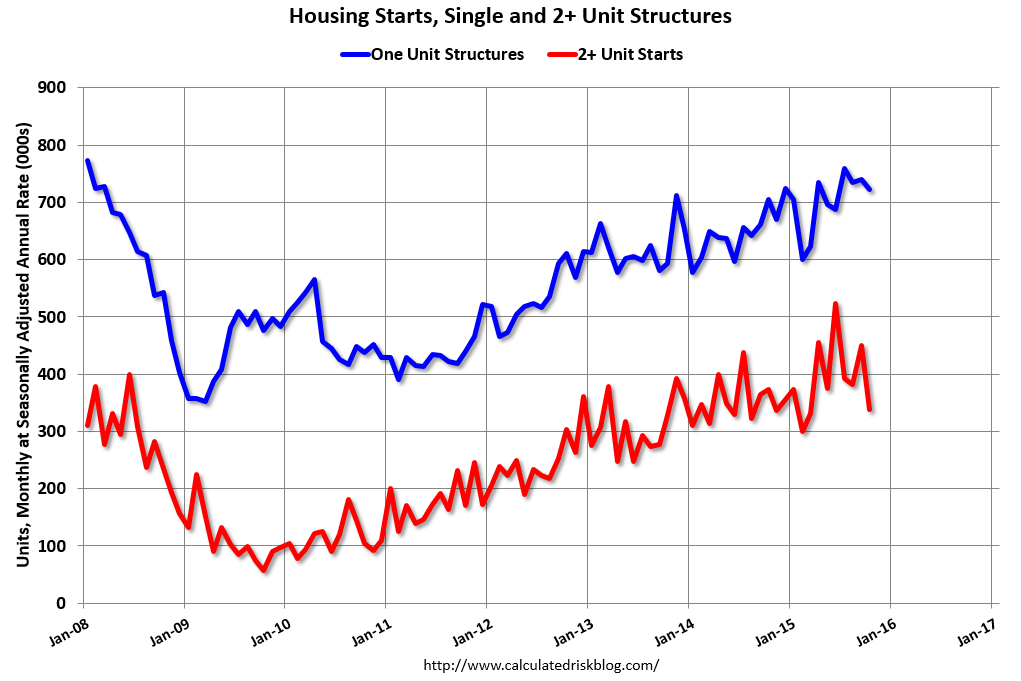
Housing starts declined 11% M/M and 1.8% Y/Y. The primary reason for the drop was the multi-family sector, as this chart from Calculated Risk shows:
The composite starts number (which combines one and multi-family dwellings) printed between ~1.1 and 1.2 million for the last 5-6 months:
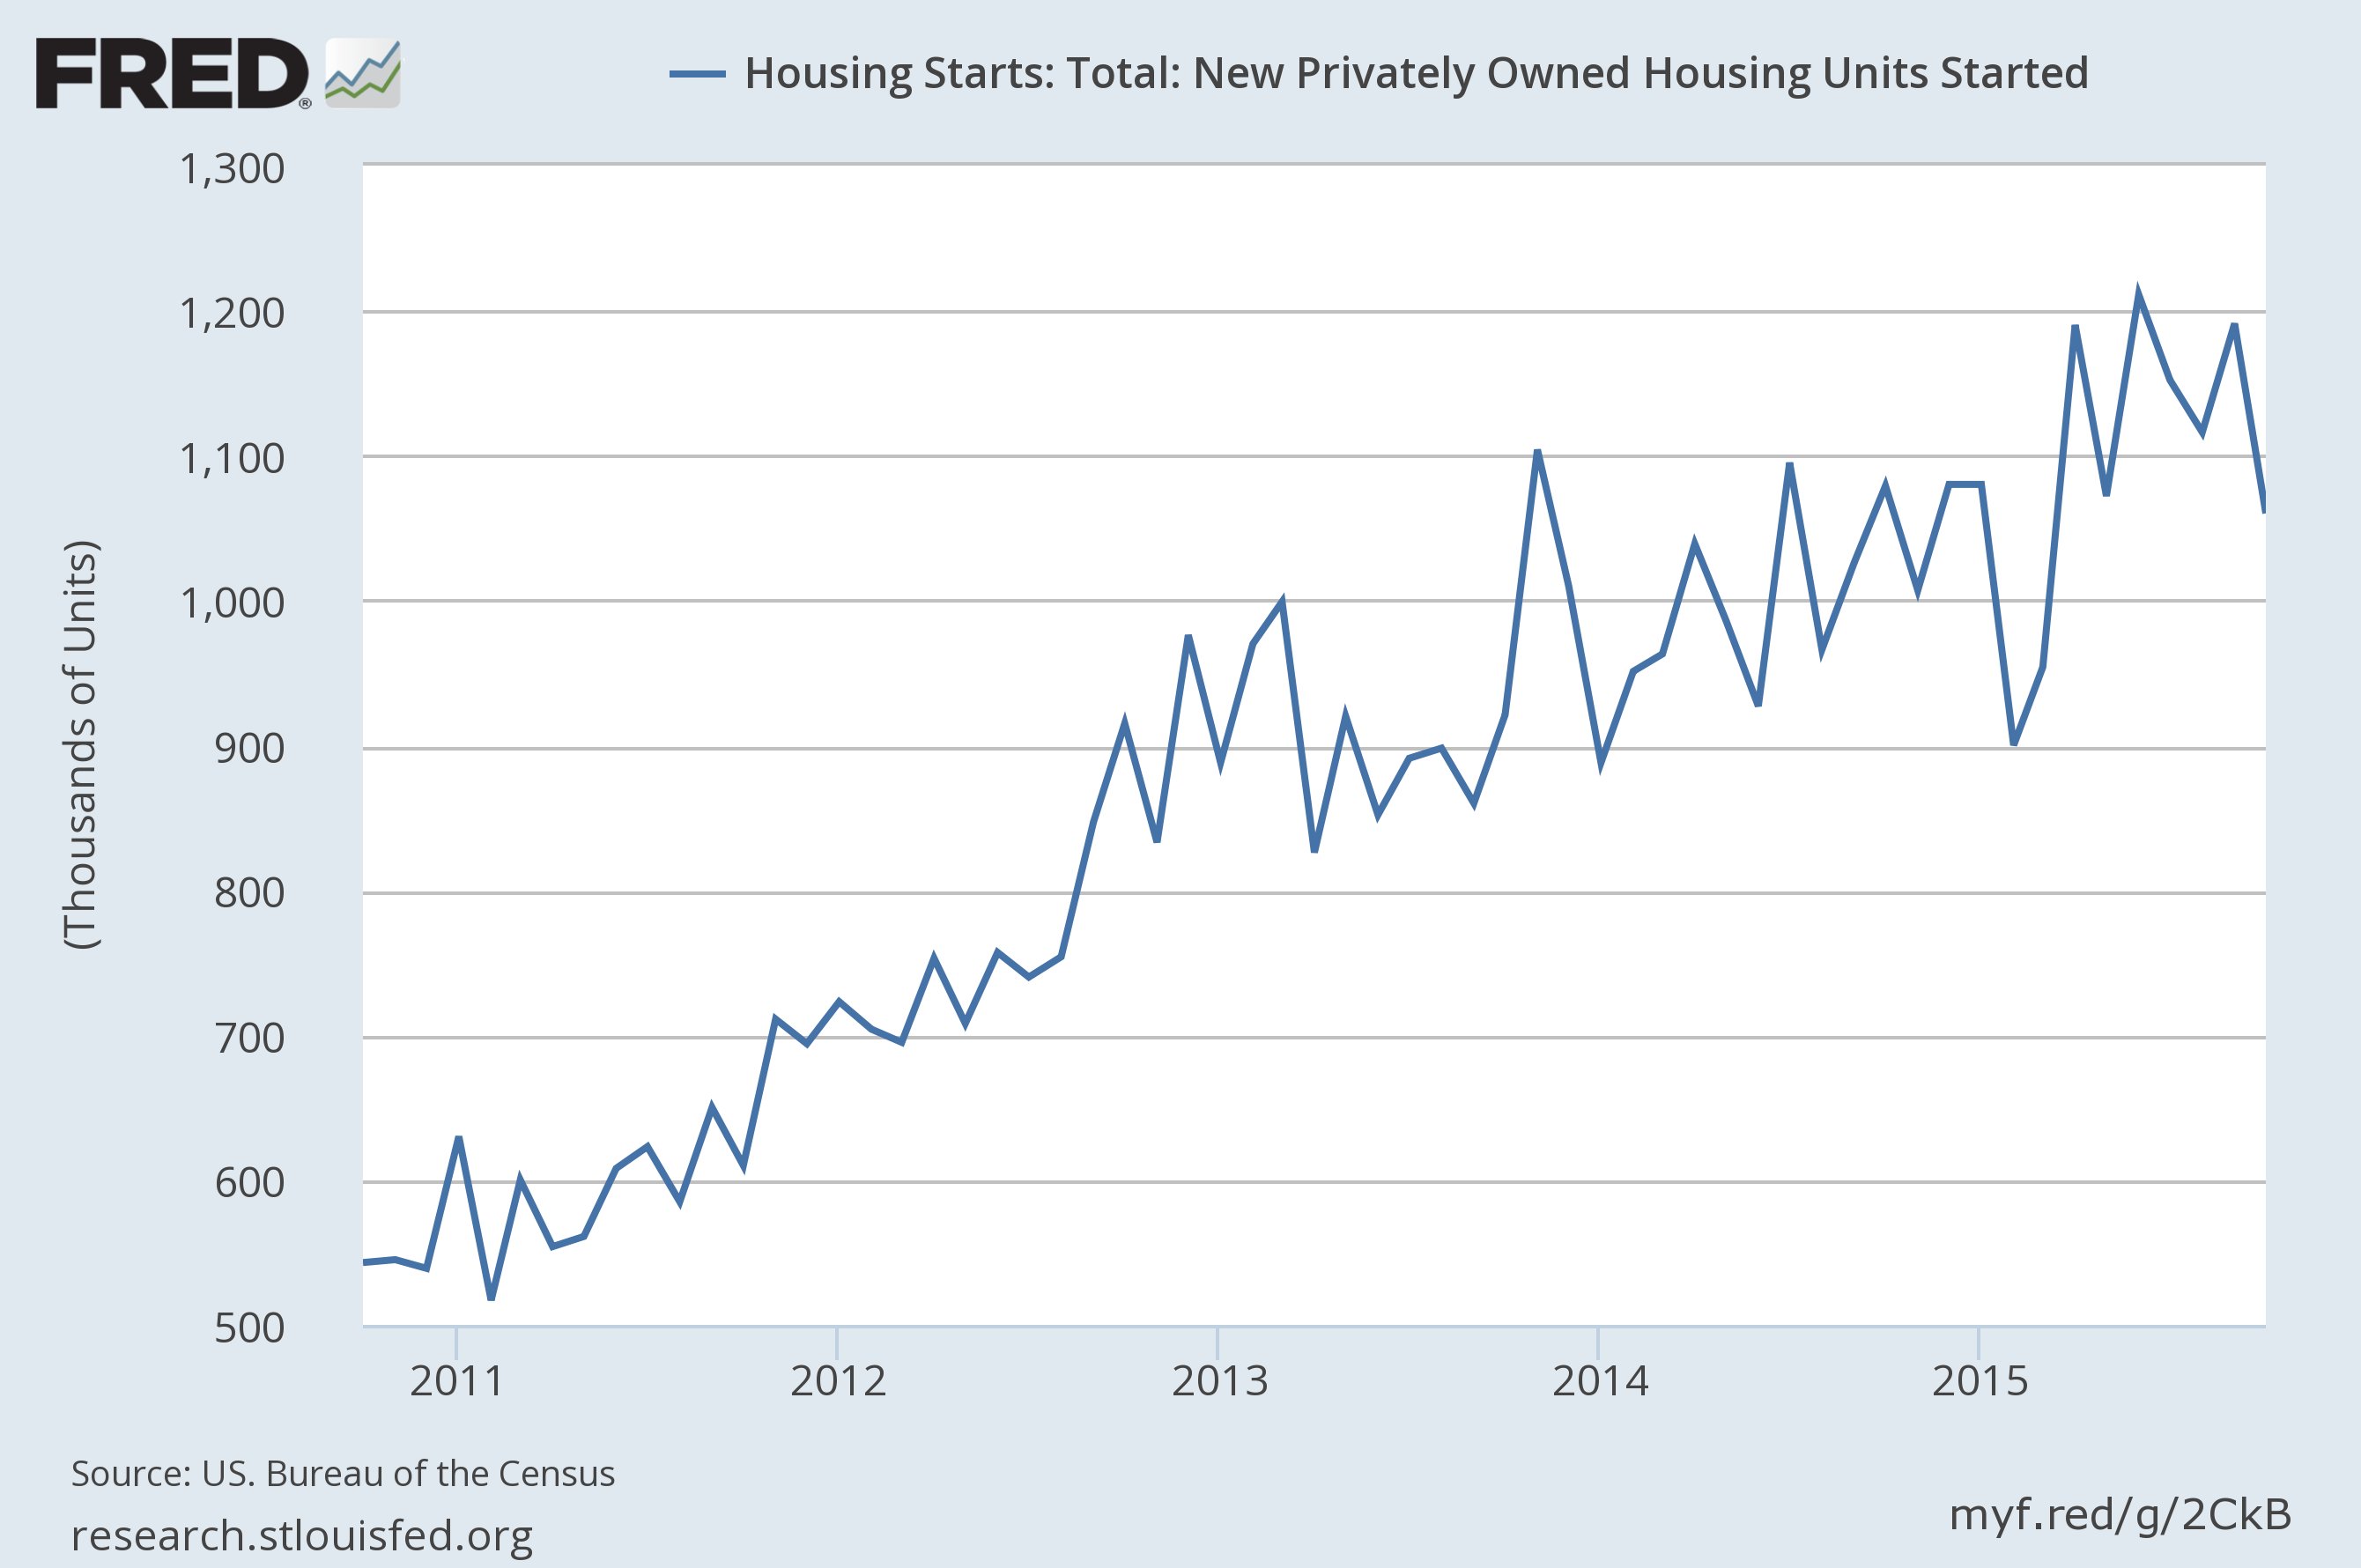
However, permits increased 4.1% M/M, which is strong precurser of starts:
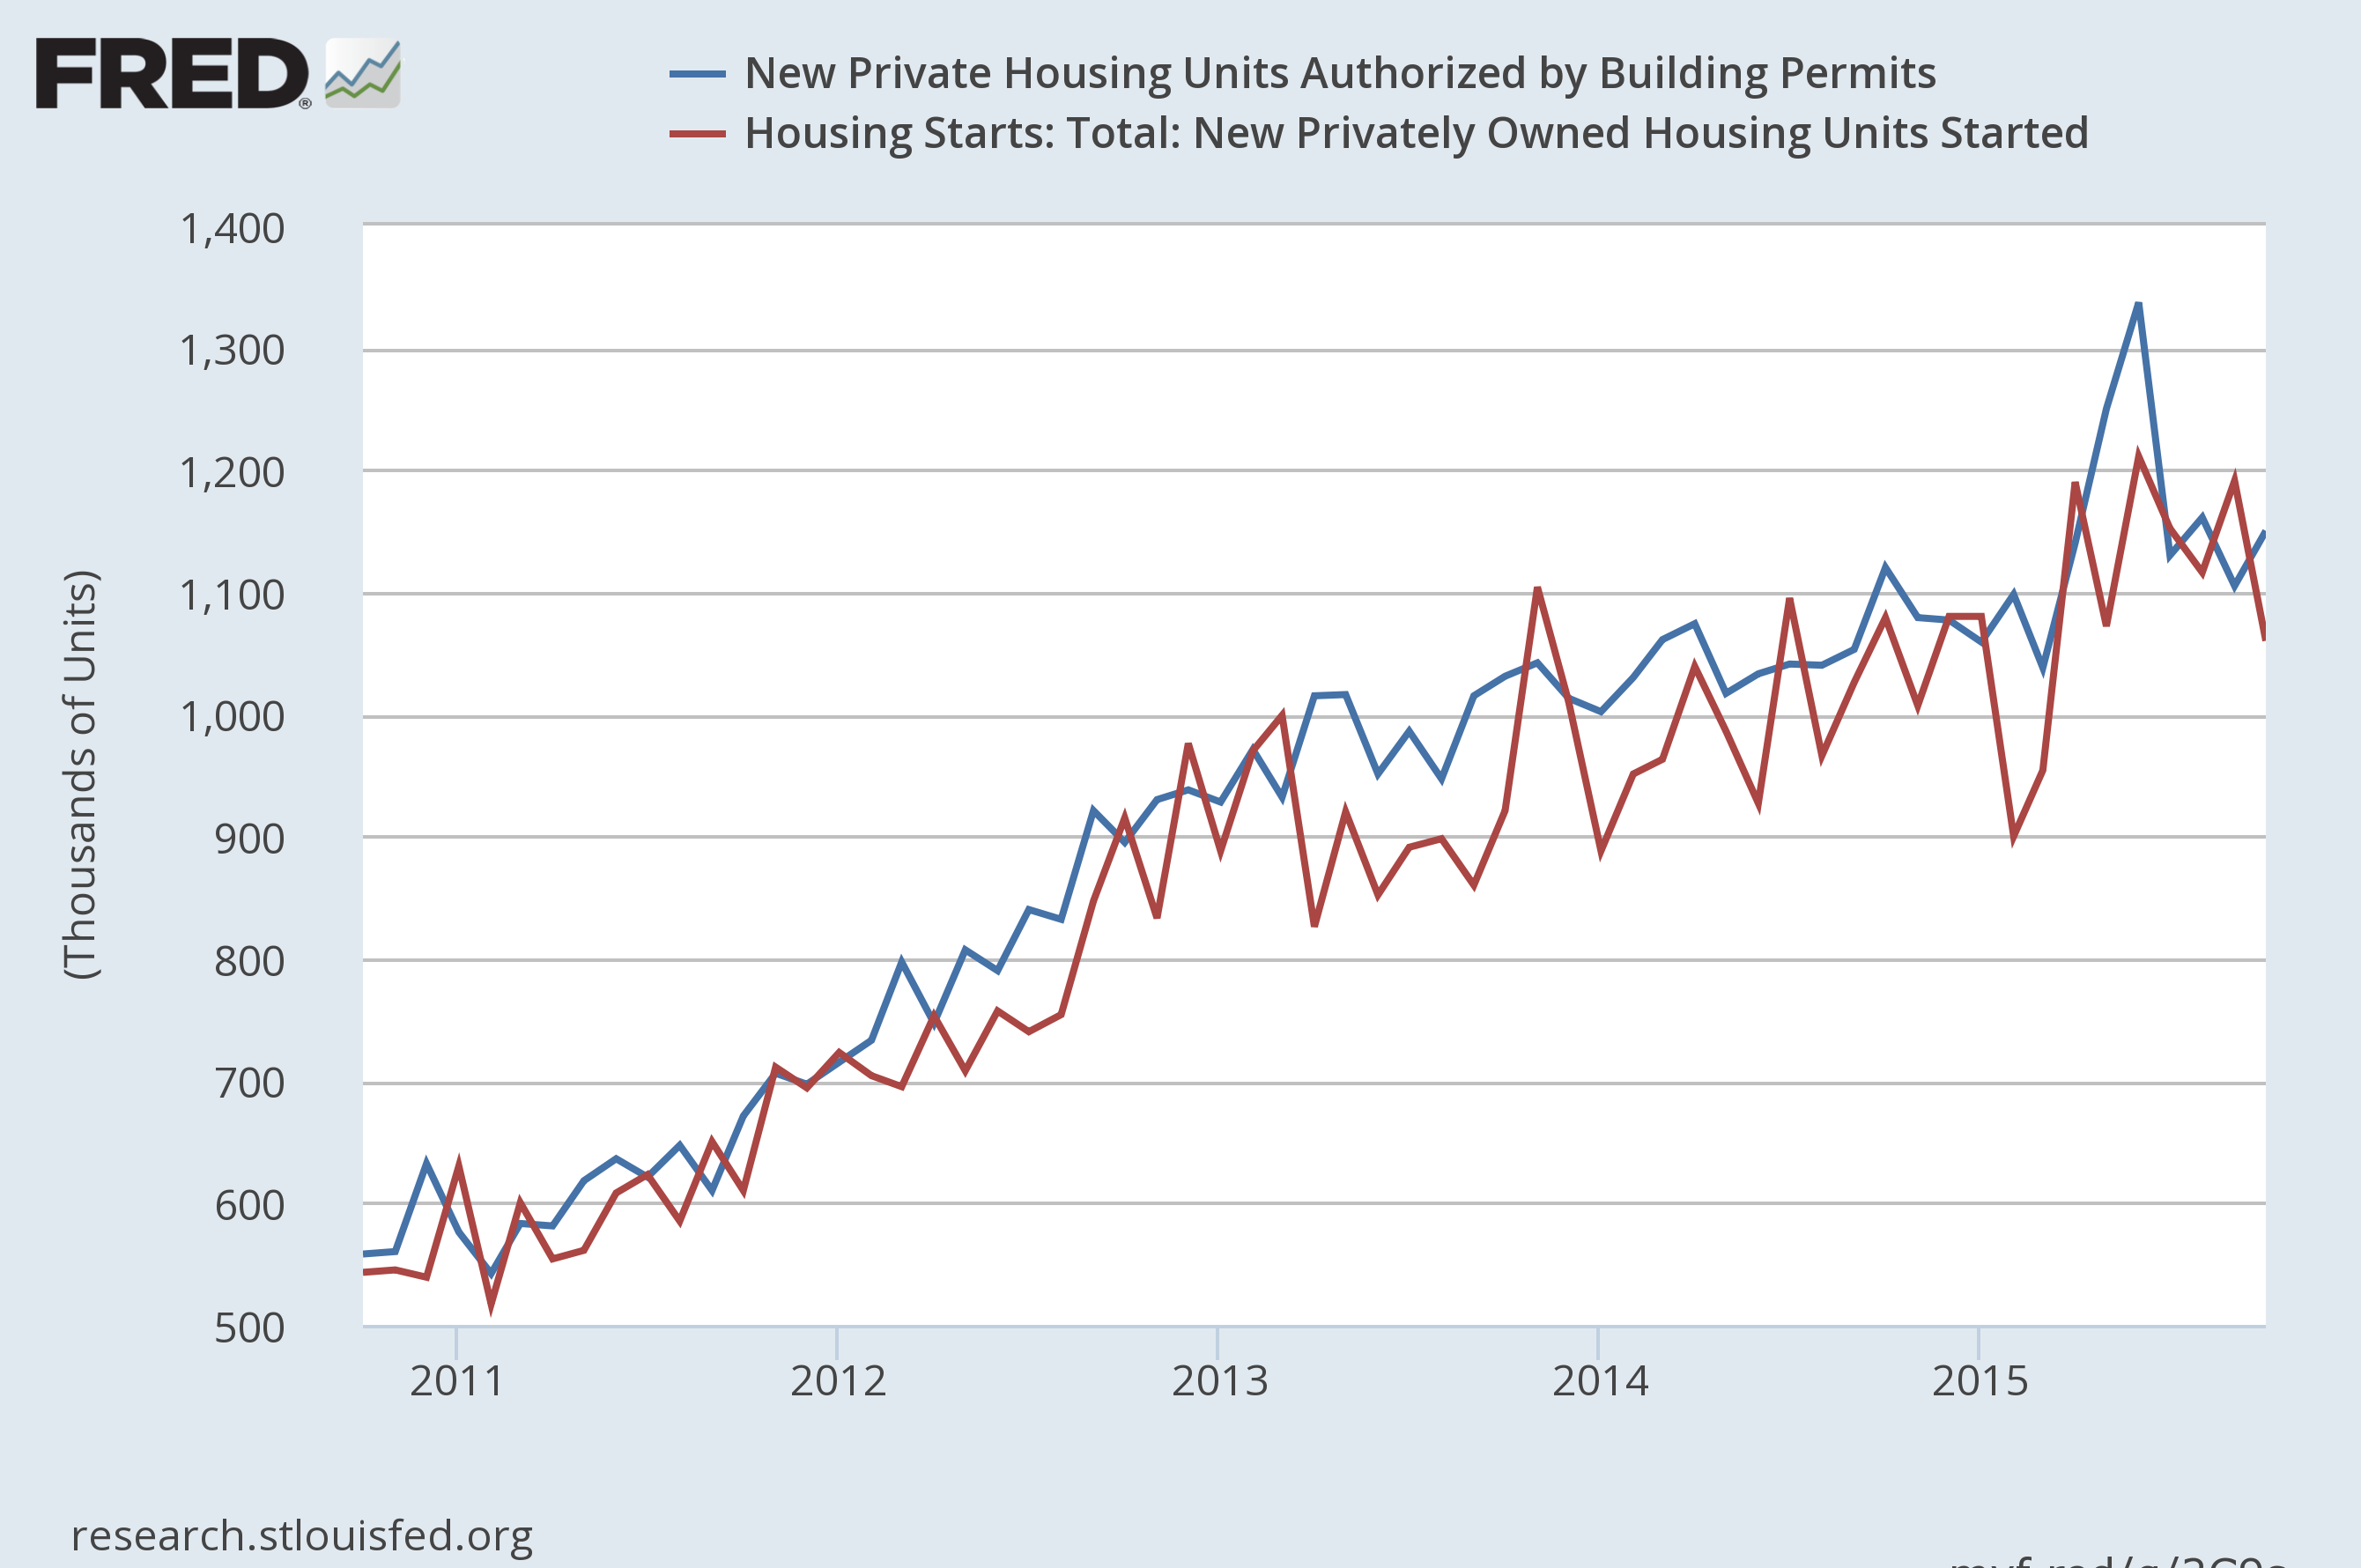
Overall, the housing news remains positive. Permits – a leading indicator – continue to increase. The decline in starts follows large increases over the last 2-3 months, meaning the drop is simply a natural contraction after rapid expansion.
Industrial production declined .2%, which is the third decline in the last six months. Mining dropped 1.5%, which is also the third such decline over the last half year.
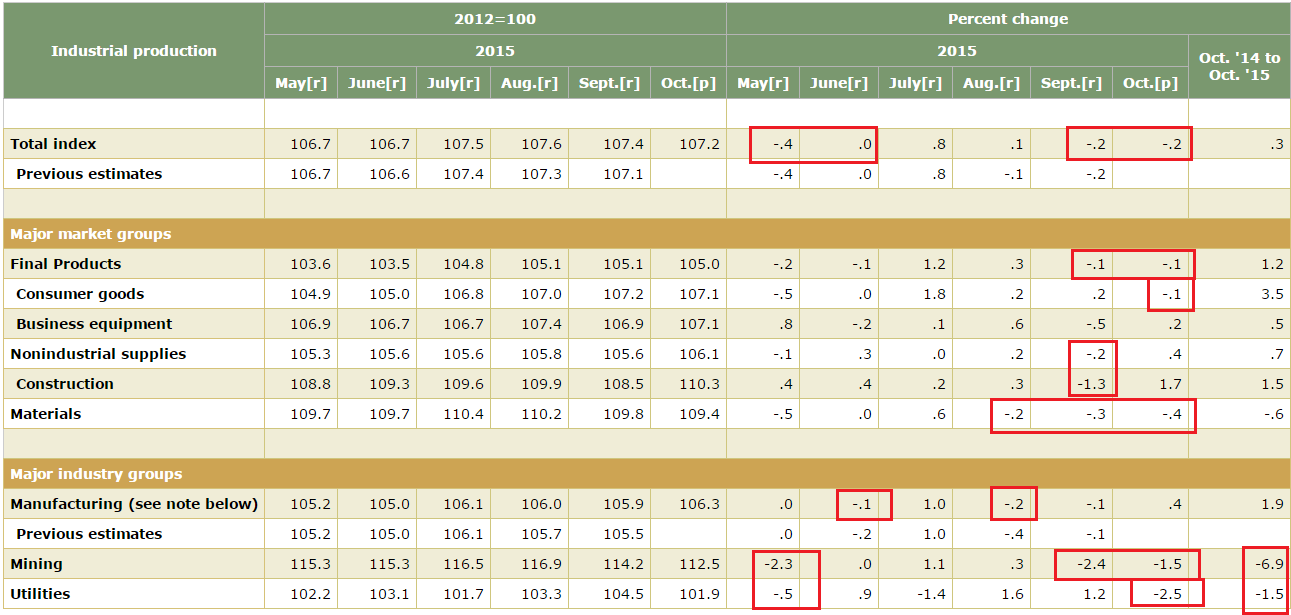
This weakness is a continued development caused by a combination of the strong dollar, weaker emerging economies and decline in oil sector capital spending.
The Atlanta Fed’s GDP model predicts 4Q GDP of 2.3%; Moody’s is a bit higher at 2.4%, while the Cleveland Fed’s interest rate curve model is 1.9%. And the Atlanta Fed’s recession predictor is 13.3%.
Economic Conclusion: The US economy continues to expand at a “moderate” pace. While recent housing news has been slightly weaker, it’s most likely a natural decline after a sharp increase a few months ago. And the increase in permits points to continued building. Industrial production continue to suffer from the strong dollar, weak oil sector and slowing emerging economies. But, the general 4Q GDP projections continue pointing towards growth right around 2%.
The market is expensive. The current and forward PE ration for the SPYs/QQQs (O:QQQ) is 23.12/23.02 and 17.48/19.88, respectively. The 3Q earnings were disappointing. From Zacks:
The lack of revenue growth didn’t come as much of surprise given the well-known macro headwinds like global growth worries and the strong U.S. dollar. But the fact that so few companies have been able to beat the lowered top-line estimates has been a big disappointment.
Looking at Q3 as a whole, combining the actual results from the 472 S&P 500 members with estimates for the still-to-come 28 index members, total earnings for the index are expected to be down -2.5% from the same period last year on -4.0% decline in revenues. This would follow the -2.1% decline in earnings on -3.5% lower revenues in the preceding quarter. Excluding Energy, total earnings for the S&P 500 index would be up +3.9% in Q3 on +1.1% higher revenues.
The blended revenue decline for Q3 2015 is now -3.9%. At the sector level, the Energy and Materials sectors reported the largest year-over-year decreases in sales of all ten sectors. On the other hand, the Telecom Services and Health Care sectors are reporting the highest year-over-year growth in sales for the quarter.
In terms of revenues, 45% of companies have reported actual sales above estimated sales and 55% have reported actual sales below estimated sales. The percentage of companies reporting sales above estimates is well below both the 1-year (53%) average and the 5-year average (57%).
This lack of revenue momentum is a primary reason for my slight bearishness on the markets. And despite this week’s solid equity market performance, I still see the market as constrained for several reasons. First, there is he general sector performance for 2015. This week, Doug Kass made the following points:
Factually, 2015 has been a year in which:
- Large-cap stocks have outperformed small-cap ones.
- Growth stocks have outperformed the cyclical sectors.
- Developed markets have outperformed emerging ones.
- Investment-grade debt has outperformed the high-yield market (i.e., "junk” bonds).
These are all signs of a market top. Also consider the following five charts, starting with the transports:
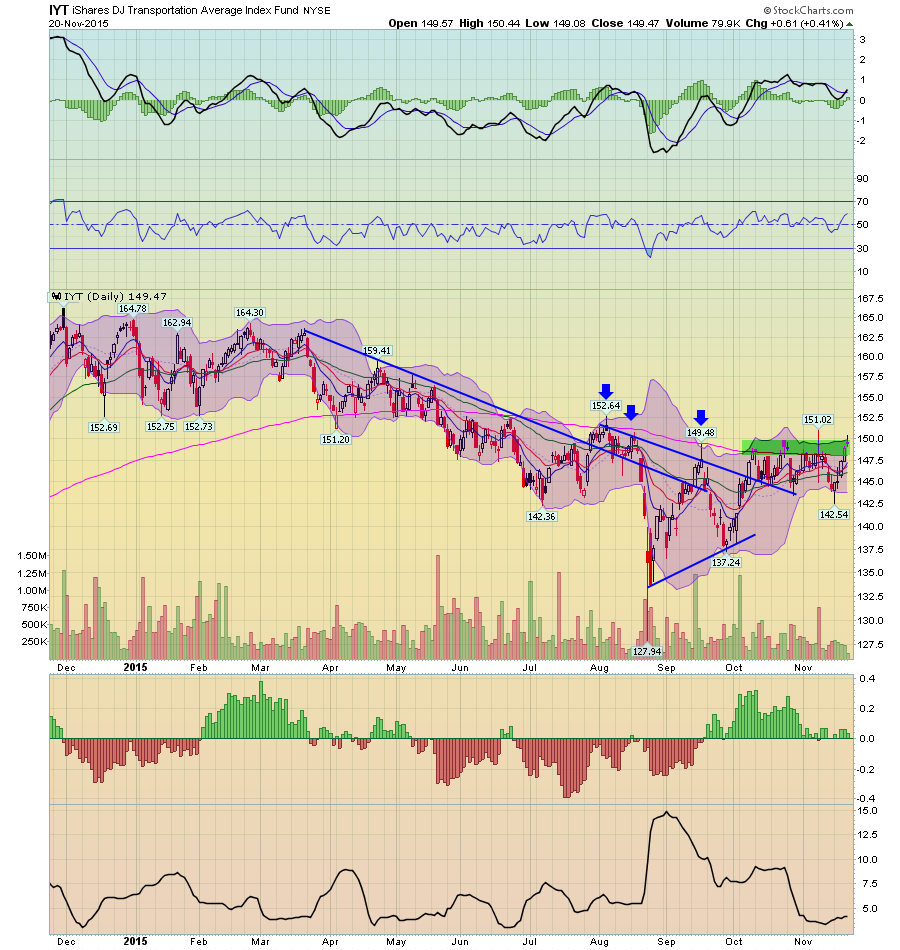
The index has steadily declined since March. In August and September, it hit the 200 day EMA three times, only to be rebuffed. And for the entire October-November period, the 200 day EMA has provided solid resistance. As a result, momentum has stalled.
The Russell 2000 has a similar picture:
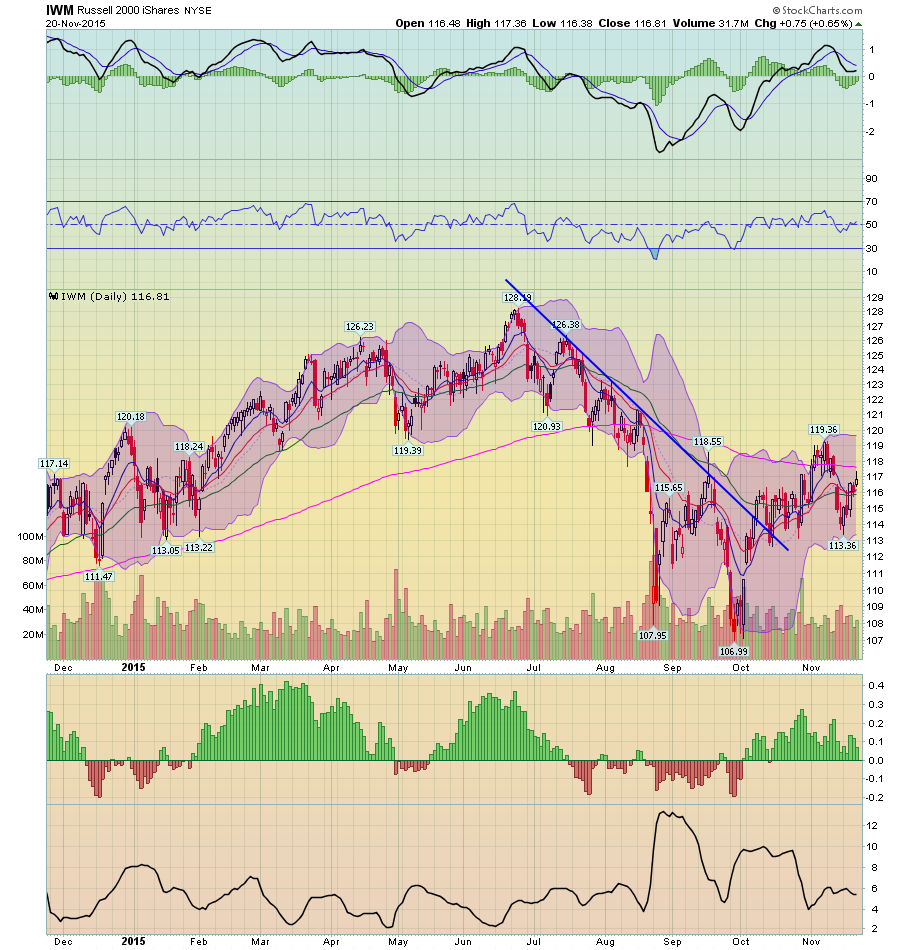
While prices closed about the 200 day EMA for the first week and half in November, they have since fallen through that level. The iShares Russell Mid-Cap (N:IWR) have a surprisingly similar chart pattern:
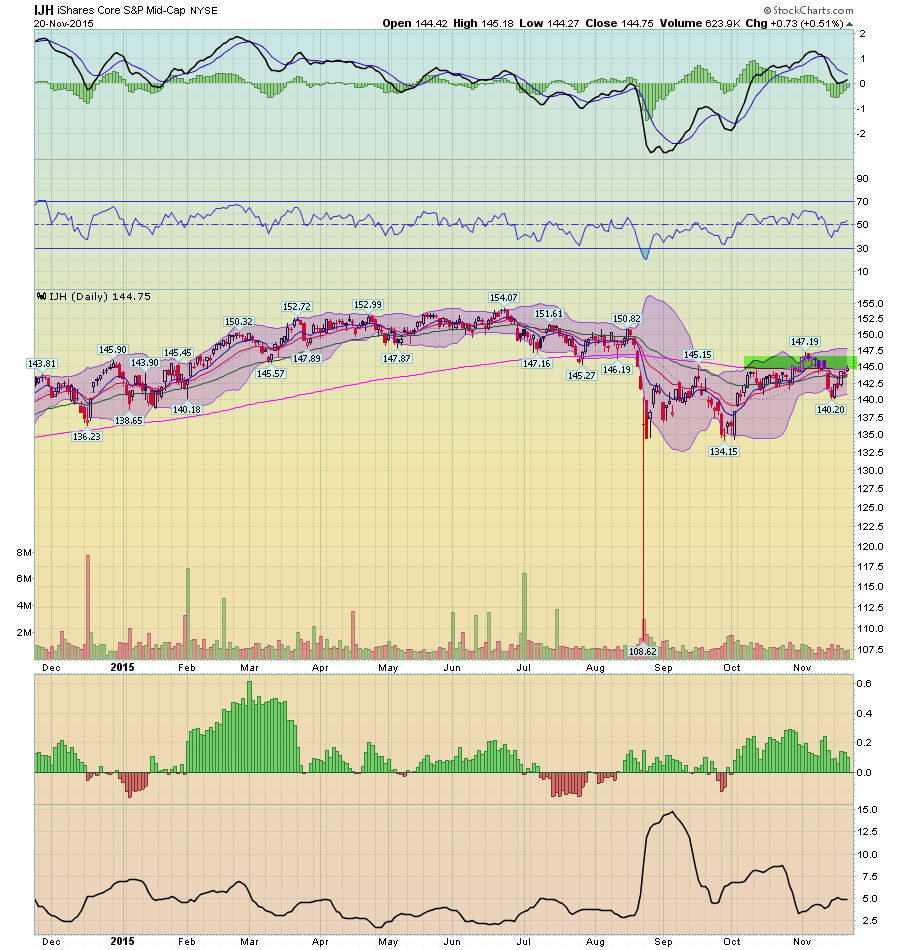
As a result, market breadth is very weak; the number of NASDAQ and NYSE stocks about their respective 200 day EMAs is very low:
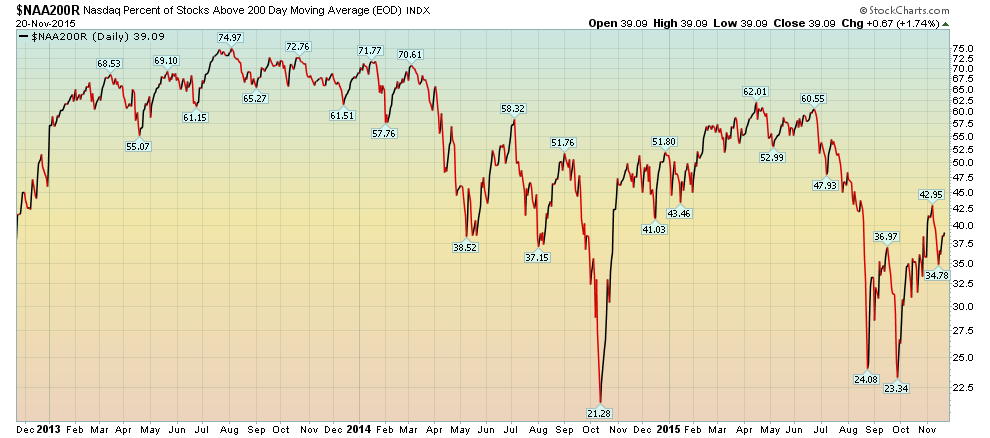
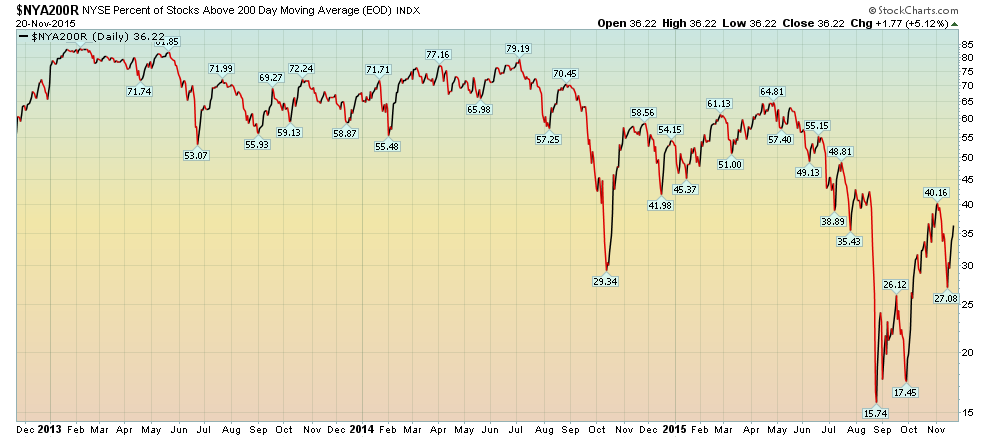
While the SPYs (N:SPY) enjoyed one of their best weeks of the year, the lack of mid and small cap participation is very concerning. That, combined with weak revenue growth and suspect market breadth makes any rally suspect.

