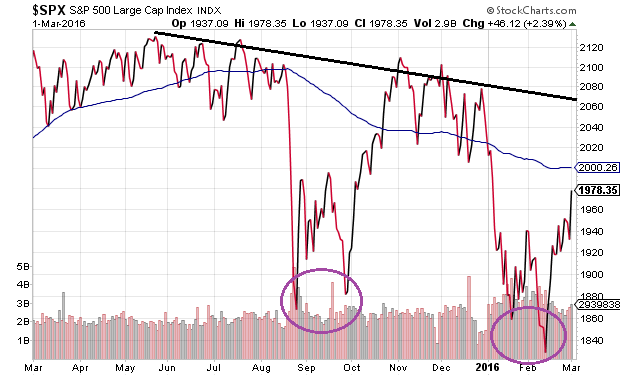
Some are interpreting the 9% bounce off of the 1812 lows for the S&P 500 as a sign that all is right with stocks once again. Indeed, many may view the S&P 500 trading at 1978 on the first day of March as a pretty good deal relative to where the benchmark began the year (2043). Yet the number of wrenches in the mountain bike wheel – fundamental valuation levels, historical price movement, global economic weakness – is likely to cause injury for the unprotected rider.
In recent commentary (Are Stocks Cheap Now? Get GAAP If You Want To Get Real), I discussed the significance of the differential between a non-GAAP P/E of 16.5 and a GAAP-based P/E of 21.5. That was with the S&P 500 trading at 1940. At 1978, the less manipulated GAAP-based version of reported earnings clocks in at a P/E of 22.
It gets worse. According to J.P. Morgan Chase, “pro-forma” non-GAAP earnings estimates have already dropped 6.2% for year-end 2016. The fact that they have dropped further than the market itself – roughly 3.2% through March 1 – means that stocks are more expensive today that they were at the start of the year. With respect to manipulated non-GAAP earnings, then, the S&P 500 at 1978 represents a Forward P/E of 17.
Fundamental overvaluation rarely matters until it does matter. In particular, consecutive quarters of declining earnings per share (EPS) typically weigh on the price that the collective investment community is willing to pay for S&P 500 exposure. For example, according to Dubravko Lakos-Bujas at JP Morgan, there have been 27 instances of two consecutive quarters for EPS declines since 1900. An economic recession came to pass on 81% of those occasions.
The S&P 500 has already contracted for three consecutive quarters. What’s more, according to FactSet, first quarter profits for 2016 are likely to fall 6.5% and second quarter earnings are likely to retreat 1.1%. That will mark 15 months of decreasing profitability.
Is earnings growth no longer a precursor for stock price appreciation? Perhaps not in 2016. Nevertheless, historical price movement alone is presenting unfriendly indications. Specifically, according to data provided by Robert Shiller and confirmed by Lance Roberts, there have been 87 instances since 1900 when the equivalent of the S&P 500 declined for three consecutive months. Make that 88. The S&P 500 logged -1.8% in December. The benchmark registered -5.0% in January and it served up -0.5% in February.
Three consecutive months of losses is not really that unusual. That said, 74 of those previous 3-month negative runs involved a 20%-plus bear market descent. Historical probability wonks might take notice that a bear transpired 85% of the time.
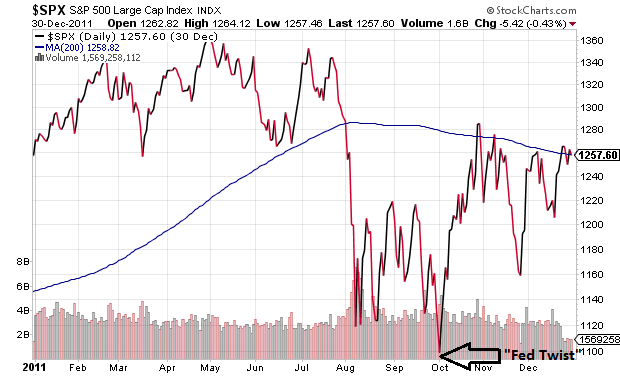
More recently, the S&P 500 last registered three straight months of losses in the summer of 2011. The 19.4% price collapse may not have qualified for an official bear market descent. On the other hand, a 19.4% erosion from the top today would mean the S&P 500 dropping to 1716. If you are not prepared for the possibility, you might want to lighten up on your stock allocation.
Keep in mind, stock valuations at the lows as well as the highs of 2011 were far more attractive than they are at this moment in 2016. Investors in 2011 also benefited immensely from a stimulus-minded Federal Reserve. How much so? Near the bottom of the September-October lows, the Fed launched “Operation Twist.” The promise of selling short maturity U.S. treasuries to acquire long maturity U.S. treasuries depressed borrowing costs and stoked the stock fire.
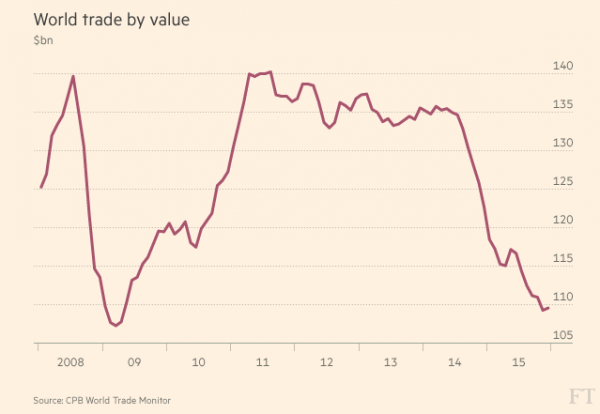
For one to believe that the “coast is clear,” he/she would have to ignore the valuation conundrum as well as the history of EPS contractions and historical price movement. One would also need to dismiss economic weakness around the globe. Consider world trade measured by volume or by dollars. The last time world trade activity was this anemic? 2008-2009. And before that? 2001-2002.
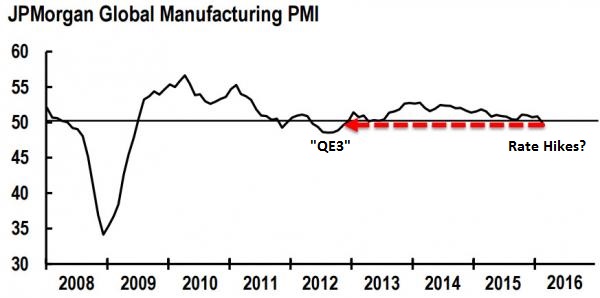
It does not get any more cheerful if you examine global manufacturing data. According to data compiled by Markit, nearly three quarters of economies around the world worsened in February. Meanwhile, JP Morgan’s Manufacturing PMI is sitting at the stagnation line. The last time the global economy had weakened to such an extent? The U.S. Federal Reserve launched open-ended quantitative easing (a.k.a. “QE3.”) – it’s most influential stimulus measure ever.
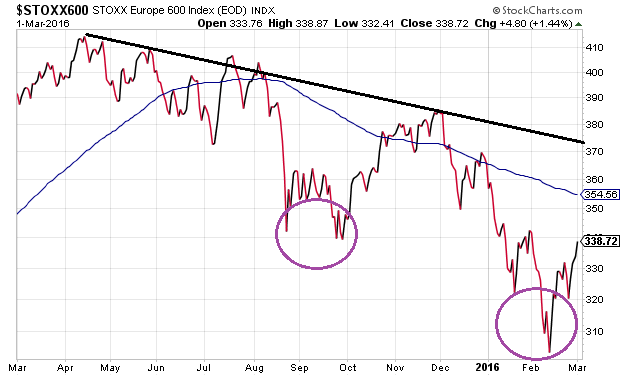
The bear market in European stocks provides perspective on what to expect stateside. Specifically, the Stoxx Europe 600 Index has already dropped 26.5% from a high-water mark set in April of 2015. There was a double bottom in August-September of 2015, and again in January-February of 2016 at a lower ebb. There were a number of false dawns as well. As it stands, though, the bear that began in April of 2015 will likely remain intact until the slope of the downtrend turns positive.
The top-to-bottom decline of 14.1% over nine months on the S&P 500 does not officially meet the 20% bear market definition, but the bear likely began in May of 2015 nonetheless. There was a double bottom in August-September of 2015, much like there was with the Stoxx Europe 600. And a lower one reached in January-February, much like the Stoxx Europe 600. Until the slope of the longer-term trend reverses course, however, one should anticipate sellers of strength to win the battle.
We remain underweight equities for our moderate growth-and-income clients at Pacific Park Financial, Inc. Our current allocation of 45%-50% stock – only large-cap U.S. stock – has been in place for the better part of the last seven months. Our top holdings include ETFs like iShares MSCI USA Minimum Volatility (NYSE:USMV), iShares MSCI USA Quality Factor (NYSE:QUAL) and Vanguard High Dividend Yield (NYSE:VYM). Each has provided slightly enhanced risk-adjusted returns over the SPDR S&P 500 ETF (NYSE:SPY) Trust (AX:SPY) during the downtrend.
Disclosure: Gary Gordon, MS, CFP is the president of Pacific Park Financial, Inc., a Registered Investment Adviser with the SEC. Gary Gordon, Pacific Park Financial, Inc, and/or its clients may hold positions in the ETFs, mutual funds, and/or any investment asset mentioned above. The commentary does not constitute individualized investment advice. The opinions offered herein are not personalized recommendations to buy, sell or hold securities. At times, issuers of exchange-traded products compensate Pacific Park Financial, Inc. or its subsidiaries for advertising at the ETF Expert web site. ETF Expert content is created independently of any advertising relationships.
