Funny, huh? Yet round numbers do tend to scare investors. Like when we all thought the year 2000 was going to be significant, because we live in a base ten world our minds become excited when we see round numbers. 100 mph, $3.00 per gallon gasoline, $20 per pound grass fed beef. It is sometimes good excitement and sometimes bad. It creates a worry when these numbers happen in the stock market indexes. And today we have two big ones to deal with: 6000 in the NASDAQ 100 and 2500 in the S&P 500.

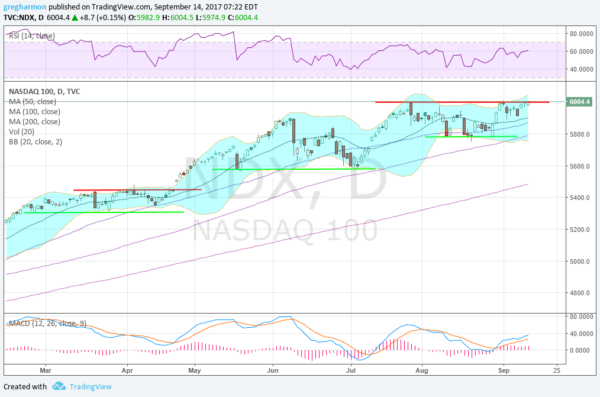
Let's start with the NASDAQ 100, because it has been stuck at 6000 for 6 weeks. The chart below shows the price action since March. What do you see? There have been a few sideways price movements since then. The first was a price channel between 5300 and 5450. The second support over 5600. The third a channel between 5800 and 6000. Other than 5450 all of these are round numbers. As the NASDAQ 100 holds at 6000 the market rhetoric has been picking up for a need for a pullback. But what if you hide the numbers and just look at the price action below.

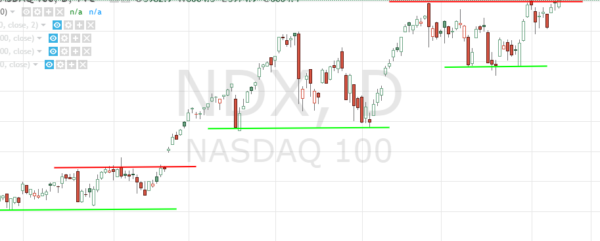
This turns the chart into nothing more than a stair step pattern to the upside. Change the numbering to a base eight count for the programmers and the fear would be gone. Or what about just re-calibrating it, like a 7 for 1 share split? Would you be less worried if the NASDAQ was at 857 tomorrow? The S&P 500 is just getting to this point, touching near 2500 Wednesday. Will it be stuck there for 6 weeks or more too?

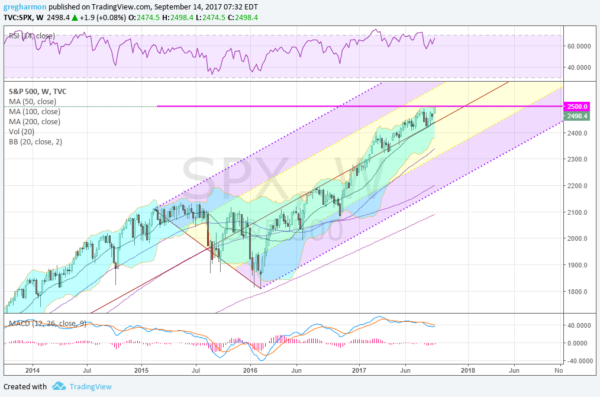
In this chart I have added an Andrews Pitchfork to give you a better sense of the trend in the index. Since it started higher at the beginning of 2016 it has steadily moved higher along the Median Line. The first year running just under it and now using it as support. But never getting outside of the middle channel. Yet now at 2500 we need to worry?
The human mind is an incredible thing but we have been reminded by many that it is programmed to avoid danger and look for fear. There is nothing wrong with looking for danger in the market and preparing for it. But both of these charts show a pattern of moving higher, either steadily or with steps. You may be fearful but the Nasdaq 100 and S&P 500 are not.
DISCLAIMER: The information in this blog post represents my own opinions and does not contain a recommendation for any particular security or investment. I or my affiliates may hold positions or other interests in securities mentioned in the Blog, please see my Disclaimer page for my full disclaimer.
