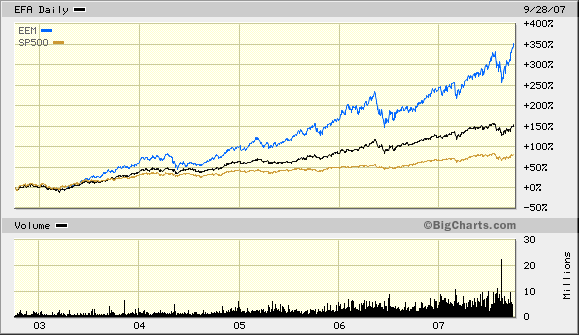
During the previous bull market (10/02-10/07), financial media fawned over the critical importance of diversifying one’s equity exposure across the globe. And why not? Performance for foreign exchange-traded trackers like iShares MSCI EAFE (N:EFA) and iShares MSCI Emerging Markets (N:EEM) far surpassed anything the S&P 500 could muster up; developed international markets doubled U.S. capital appreciation while emerging economies catapulted 350%!

Indeed, when I spoke at conferences 10 years ago, attendees rarely inquired about companies listed on the NASDAQ Composite or the NYSE. They wanted to know if they should add a materials exporting giant like iShares MSCI South Africa (N:EZA) to their portfolios or whether or not Market Vectors Brazil Small-Cap (N:BRF) would be a sensible way to tap consumer purchasing power in Latin America. Accessing overseas markets dominated speaker presentations as well as listener curiosity.
In 2000, the financial planning community typically rallied around a 20% equity allocation to foreign stock. By 2007, the 20% recommendation jumped to 50%. The reason? Well-diversified investors were supposed to account for the world’s market capitalization, where one-half of the world’s market cap belonged to non-U.S. securities.
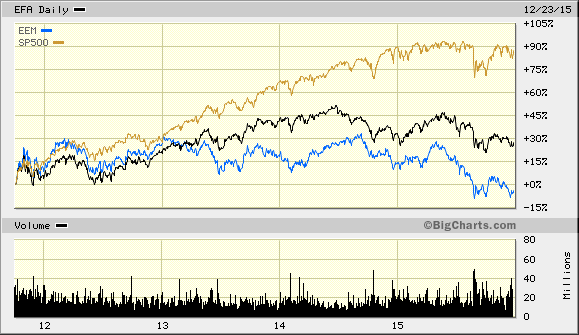
So what happened to the notion of a globally diversified portfolio? Worldly investor perspectives? Could it be that, since the euro-zone crisis in 2011, U.S. stocks have crushed foreign equities? Maybe it is easier for CNBC and Bloomberg to praise U.S. stock price gains while ignoring bearish price depreciation in foreign equity holdings – significant positions in the static allocation of the buy-n-hold viewership.

Mainstream financial commentators may choose to focus on the progress of the S&P 500 alone. They may choose to ignore corrective activity in small caps via the Russell 2000, high yield bonds via SPDR Barclays (L:BARC) High Yield Bond (N:JNK) and transporters via the Dow Jones Transportation Average. Yet ignoring bearishness in asset prices around the world is particularly near-sighted, if for no other reason that global economic weakness is the biggest threat to the worldwide profits and the worldwide revenue of large U.S.-based corporations.
The FTSE All-World Index may be particularly relevant. This benchmark covers the overwhelming majority of the world’s investable market capitalization. Its global perspective is heavily weighted toward developed regions, including the United States (52.5%), Europe with the United Kingdom (19.5%) and Japan (8.5%). Nine of the top 10 corporate constituents are U.S. companies.

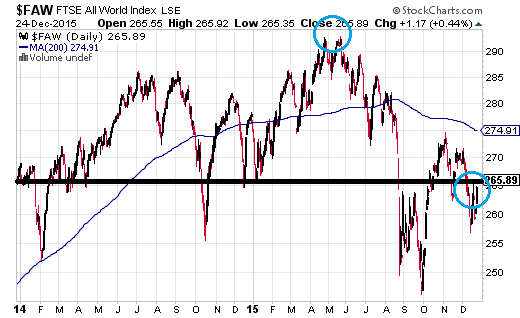
Some trends are easier to spot than others. For example, the FTSE All World Index has not appreciated in price for nearly two years. Its 200-day long-term trendline currently slopes downward. And the benchmark is roughly 9% below its summertime peak.
The good news? Prices are well above their October lows. It follows that the global benchmark may or may not have completed a 16%-17% correction several months earlier. Make no mistake about it, though. Large-cap U.S. companies like Microsoft (O:MSFT), Amazon (O:AMZN), Facebook (O:FB), General Electric (N:GE) and Wells Fargo (N:WFC) are responsible for the “resilience” of the FTSE All-World Index.
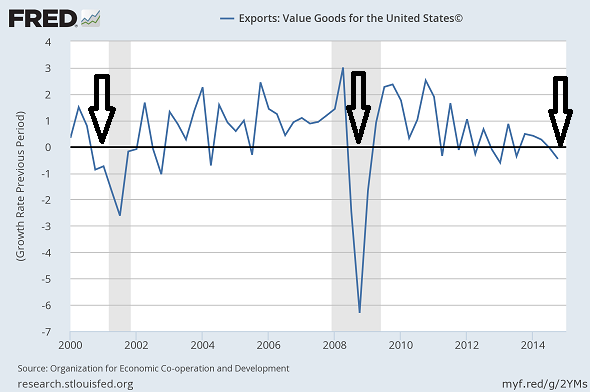
Either key economies around the world – Europe, the United Kingdom, China, Japan – pull out of their collective funk in 2016, or U.S. large-cap stocks will eventually buckle. Top-line revenue has already declined in every quarter of 2015; non-dollar denominate profits have also taken a toll on multi-national players. Equally worrisome, foreign demand has been noticeably weak in the export data.

In sum, you may not want to risk capital in overseas stocks until foreign countries and regions begin to respond to stimulus via economic expansion. Right now, most are mired in stagnation, recession or depression. Absent a desirable revival abroad, 2016 could be tough sledding for the U.S. economy and the heralded S&P 500.
Disclosure: Gary Gordon, MS, CFP is the president of Pacific Park Financial, Inc., a Registered Investment Adviser with the SEC. Gary Gordon, Pacific Park Financial, Inc, and/or its clients may hold positions in the ETFs, mutual funds, and/or any investment asset mentioned above. The commentary does not constitute individualized investment advice. The opinions offered herein are not personalized recommendations to buy, sell or hold securities. At times, issuers of exchange-traded products compensate Pacific Park Financial, Inc. or its subsidiaries for advertising at the ETF Expert web site. ETF Expert content is created independently of any advertising relationships.
