Turning Points For The Week Of June 10-14Summary
- There's a modest amount of weakness in the leading indicators.
- There's been some give-and-take in the coincidental numbers.
- My recession probability in the next 6-12 months is still at 25%.
The purpose of the Turning Points Newsletter is to look at the long-leading, leading, and coincidental indicators to determine if the economic trajectory has changed from expansion to contracting - to see if the economy has reached a "Turning Point."
My recession probability remains at 20%. The yield curve situation continues to deteriorate. But in the latest employment report, the hours of non-supervisory employees declined to its lowest level in the last five years. Finally, new orders for consumer durable goods is close to declining on a Y/Y basis.
Long-Leading Indicators
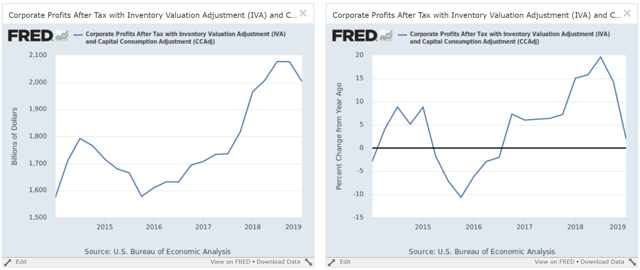
Corporate profits are still positive. But the next quarter of data is very important:
Profits enjoyed a solid pace of increase starting at the end of 2015. They decreased in the latest quarter. The Y/Y pace (right chart) is declining sharply. As I noted on Wednesday, CEO confidence has declined for the last five quarters. While it's still at high levels, it's also obvious that the constant trade war rhetoric and general global uncertainty (Brexit; the EU slowdown; the Chinese slowdown) is taking a toll.
Other long-leading indicators are positive: BBB yields are dropping with the broader bond market and M2 is growing.
Leading Indicators
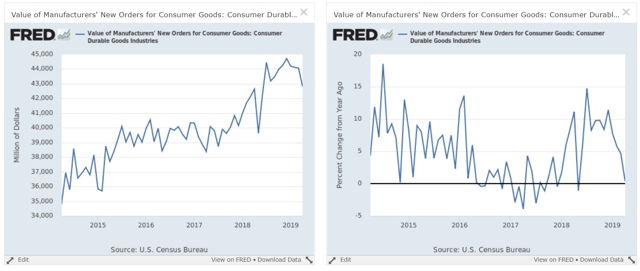
Three leading indicators are standing out for their negative implications, starting with new orders for consumer durable goods:
The left chart shows that this data has moved sideways for about the last year. The right chart shows that the pace of Y/Y gains has dropped sharply over the last few months and is now approaching 0%.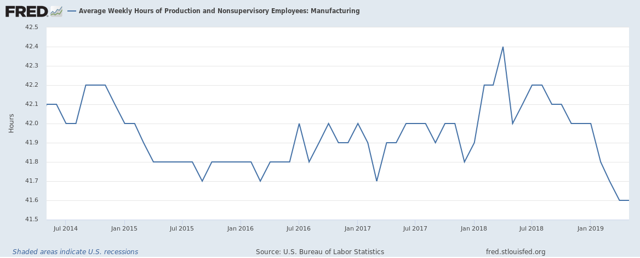
Average weekly hours of non-supervisory employees in manufacturing hit a five year low in the latest employment report. Hours are the first thing employers cut; doing so allows them to keep their current staff while cutting costs at the same time. This corresponds with the weaker readings we're seeing in the ISM manufacturing data.
And then we have the yield curve:
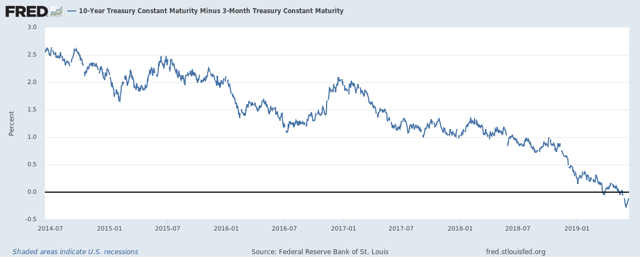
The 10-Year/3-Month spread hit a new low this week.
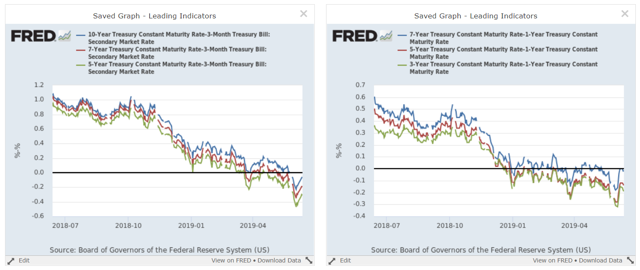
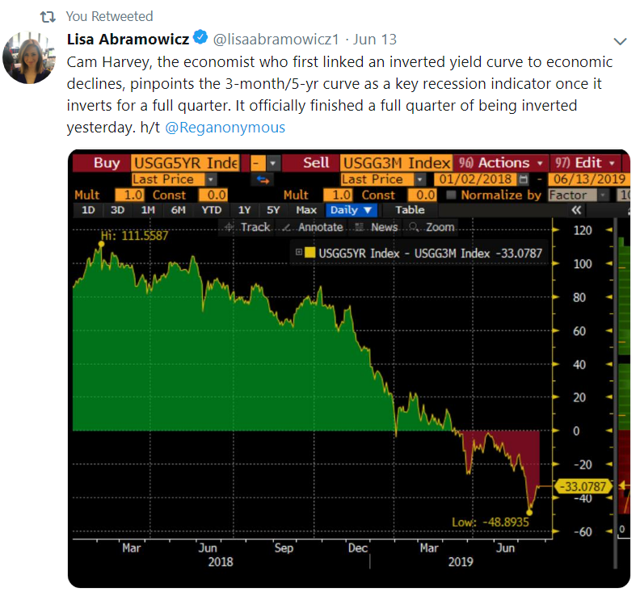
The belly of the curve continues to contract. The left chart shows the various spreads between 10, 7, and 5-year bonds and the 3-month Treasury. The spreads continue to move lower. The right chart shows the spread between the 7, 5, and 3-year and the 1-year. It remains at low levels. And on that note, consider this tweet from Lisa Abramowicz:
Turning to other indicators, although the stock market has rallied, I'm less than thrilled with the underlying technicals. I've documented this in my daily Technically Speaking column over the last few weeks (see here, here, and here). Capital goods orders ex-transport are still growing on a Y/Y basis, although the pace has declined a bit. The short-term financial markets are still very liquid and the 4-week moving average of initial unemployment claims is still at low levels.
Still, the weight of the financial data keeps my recession probability at 20%, largely due to the continuing deterioration in the yield curve. The decline in average hours worked and new orders for consumer goods adds to the negative weight.
Coincidental Indicators
Two other coincidental numbers were released this week. Industrial production rose 0.4%. Here's the table from the release:
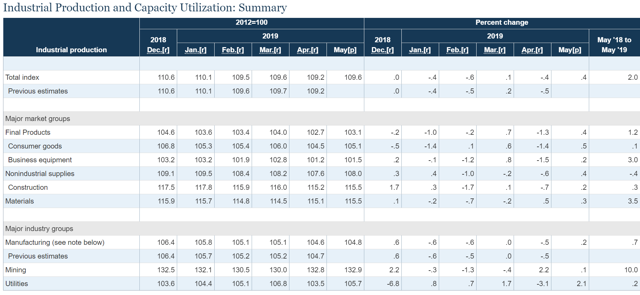
This is the strongest gain in six months. All subcategories of data rose: all major market groups were up (middle panels) as were all major industry groups. One can quibble with the amount of the gain, but there's no denying that overall this is was a good report.
Retail sales increased 0.5%. The charts show the general trend:
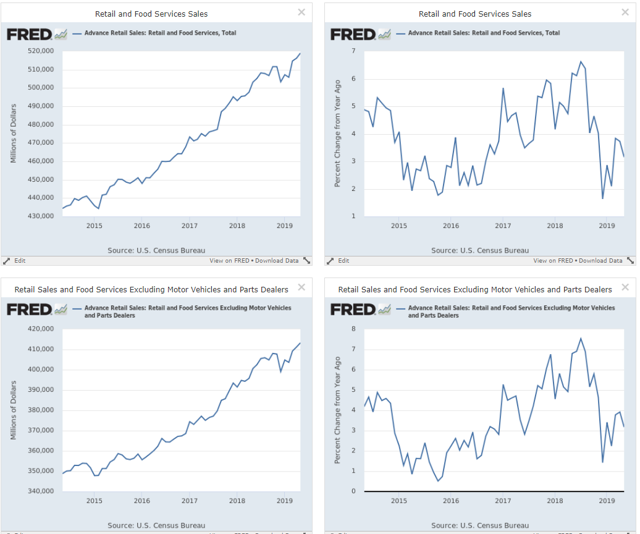
The top two charts show total retail sales; the bottom two charts show retail sales ex-autos. The left charts show the absolute level while the right charts show the Y/Y percentage gain. Both absolute numbers fell at the end of last year as a result of the falling stock market and government shutdown. Both have since rebounded. The Y/Y numbers for both also dropped at the end of last year but both are now rising. Overall, the latest report was good news, showing a confident consumer.
There's a fair amount of give-and-take in the coincidental data. When industrial production was weak earlier this year, employment gains were strong. Now that employment is weak, industrial production is picking up the slack. Unfortunately, the good news for industrial production has only lasted one month, which makes its contribution to the positive news a bit suspect.

