This post looks across global markets and asset classes to find the most relevant, compelling and unique market insights for traders and investors. The emphasis is on identifying actionable opportunities, risks, trigger points and key global market trends.
Key technical views in this report:
- US Treasuries: Neutral, but expect a short-term retest of the lows in bond yields.
- Financials: Bullish MT, but short-term risks are elevated given distance from trend.
- Euro Stoxx: Broadening top pattern means heightened near-term downside risk.
- Gold: Running up against overhead resistance, wait for a break (or otherwise).
- Commodities: Bullish strategic bias; signs of a new bull market.
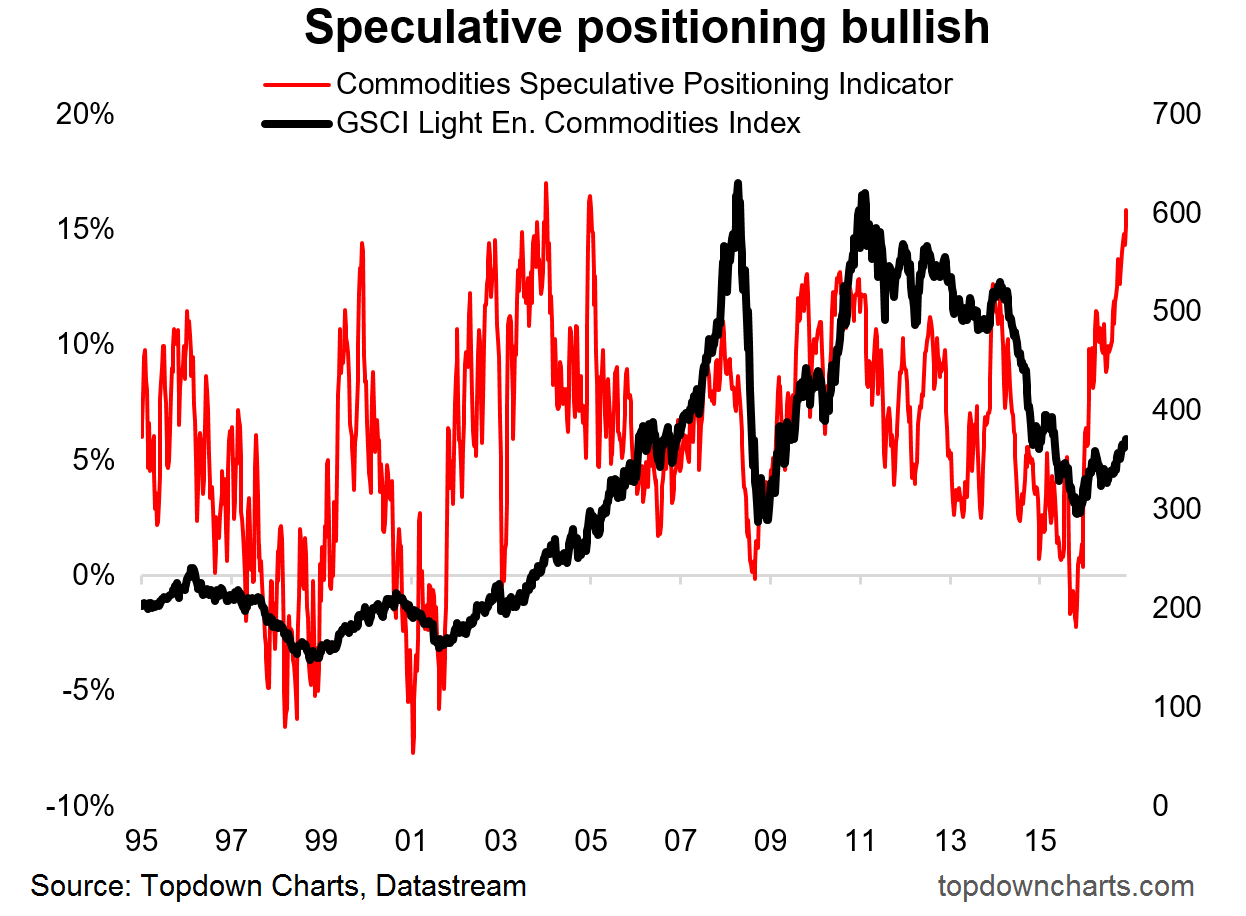
Chart of the week: Commodities Speculative Positioning Bullish
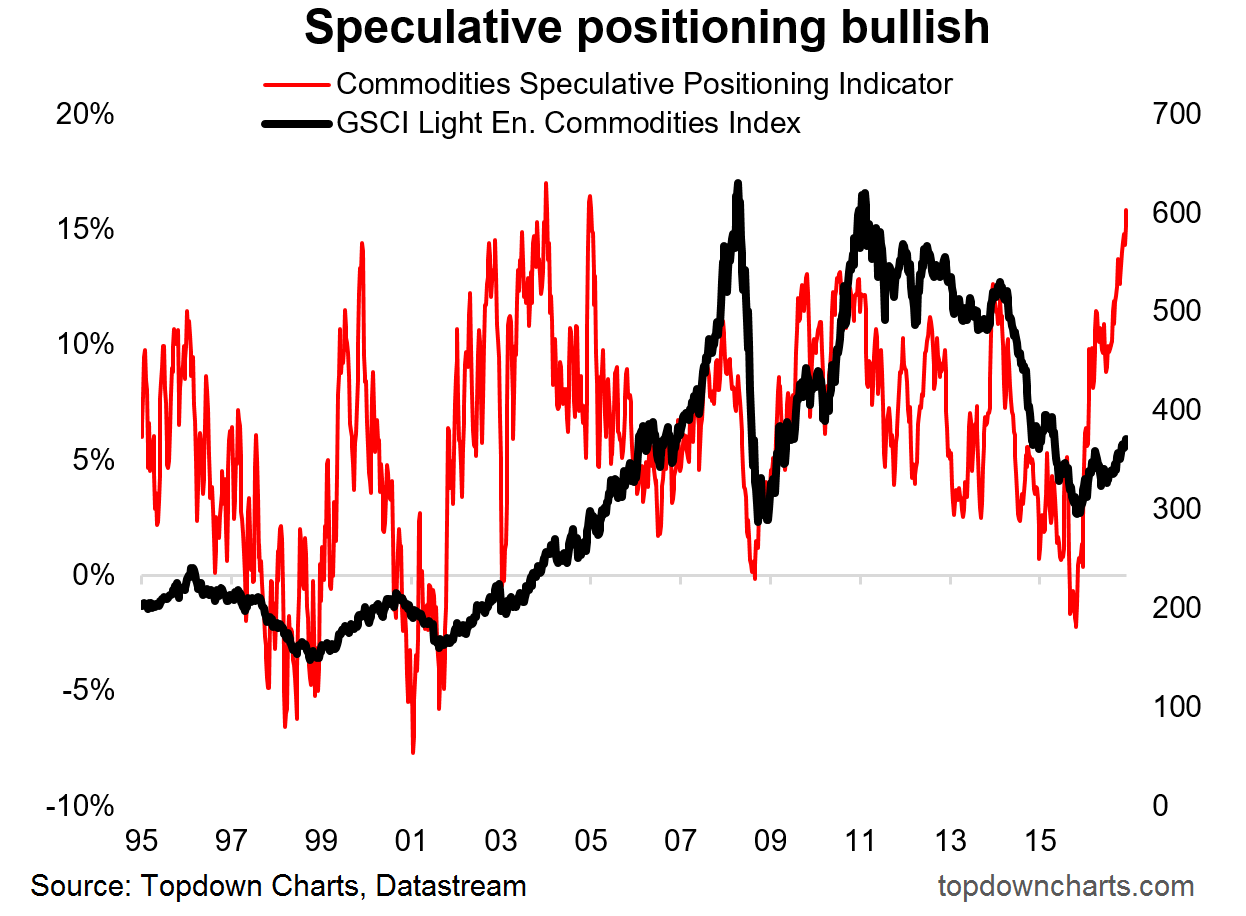
This one made it to chart of the week because of the spectacular speculative net-long positioning across commodities (a 12-year high!). See if you can figure out why I think this chart is so important for the strategic view on commodities as an asset class…
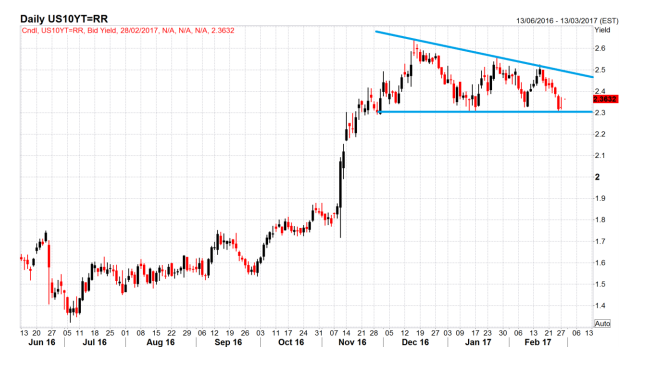
1. US 10 Year Bond Yields – Descending triangle
- US 10-year Treasury yields remain rangebound within a descending triangle pattern.
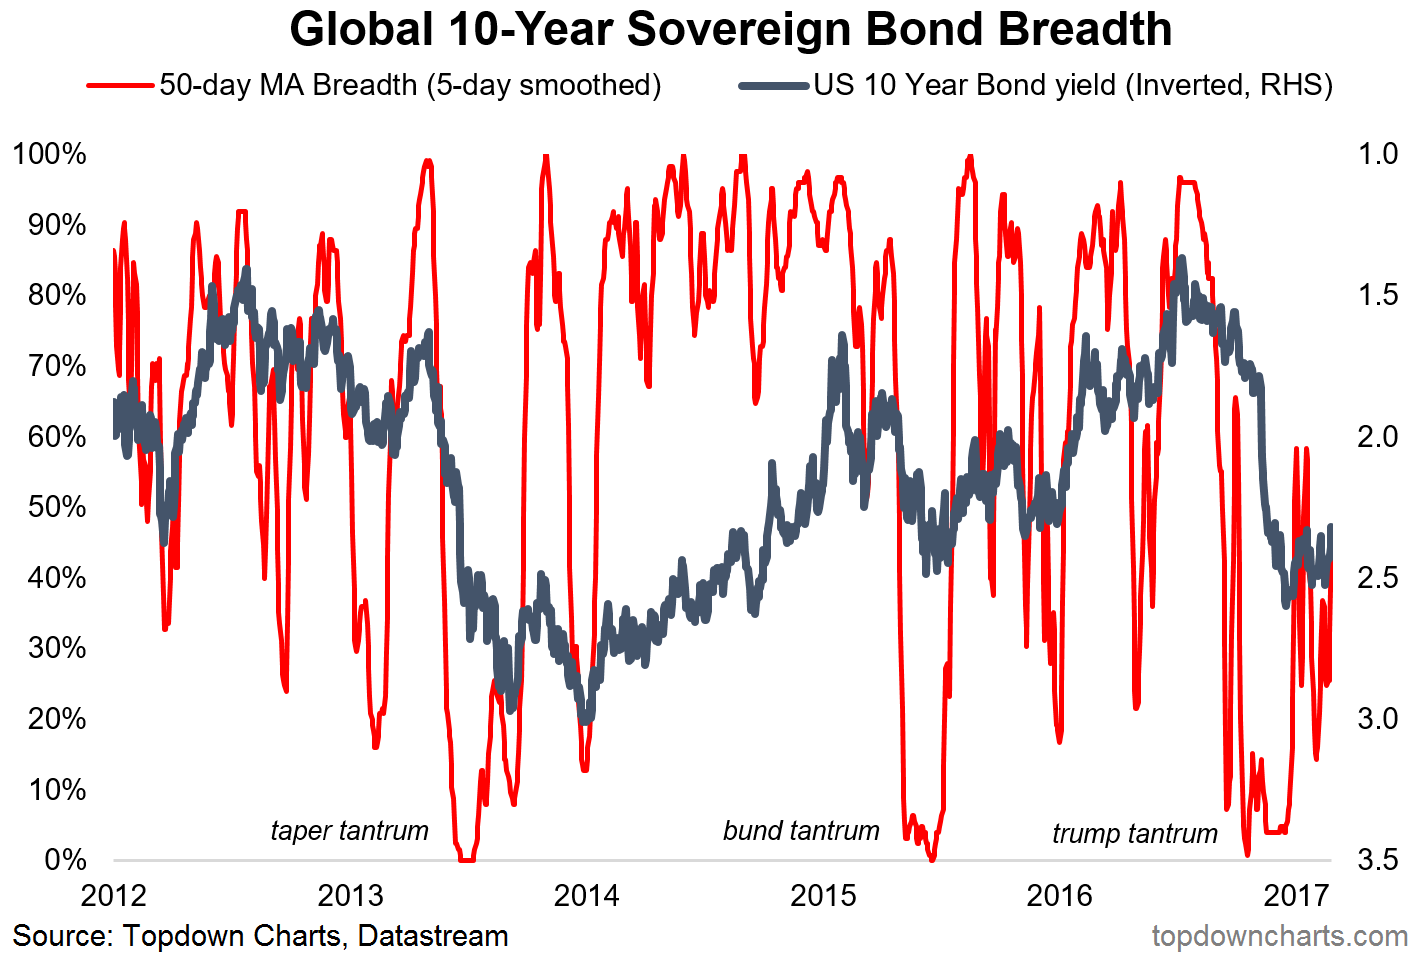
- Latest test of 2.30% highlights importance of that support level while global sovereign bond breadth appears to confirm a top in yields for now.
- Key is to wait for a break of the trendlines and go with it; simple measure rule points to as much as a 30-40bp move on a break of either trendline e.g. downside to ~1.9%.
Overall Technical View: Neutral, but retest of the lows, possibly as low as 1.9% is likely.
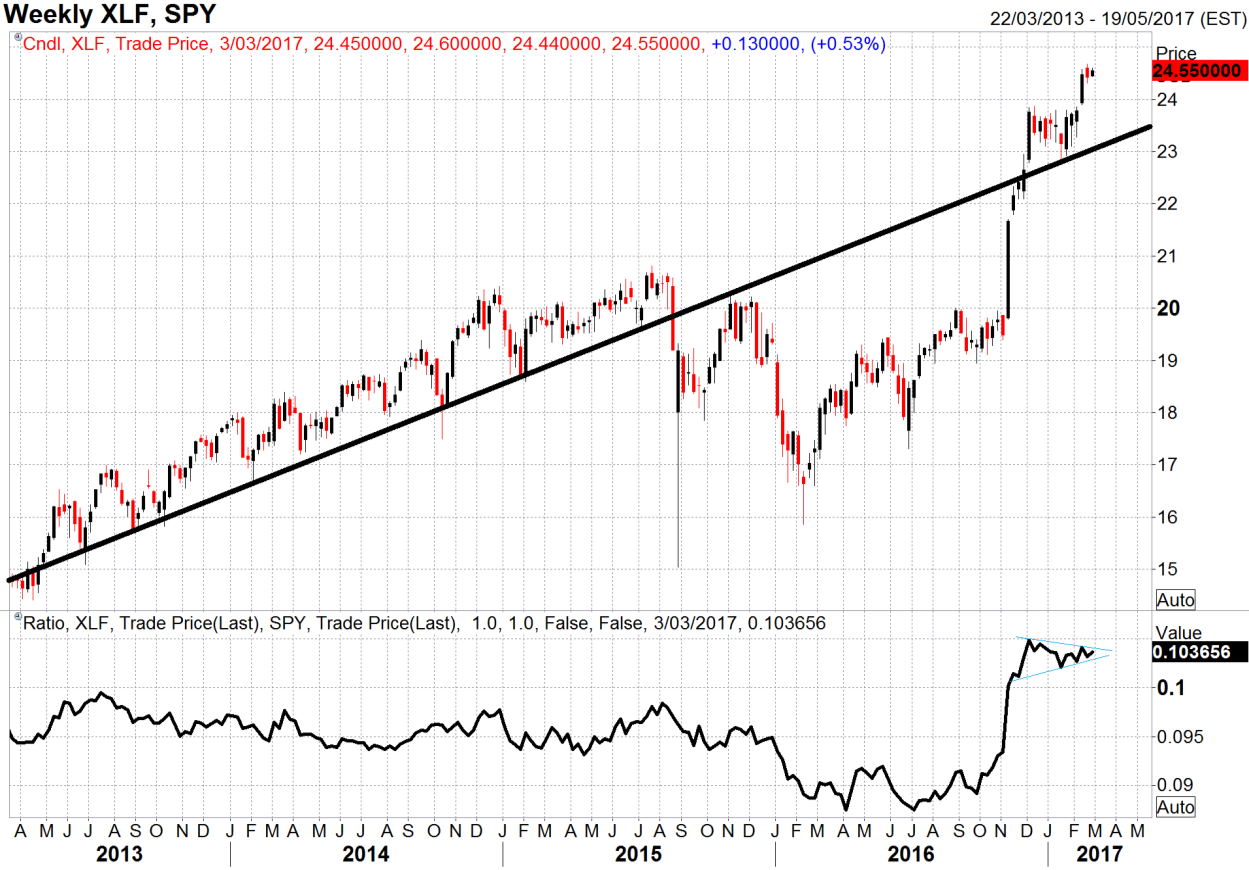
2. Financials – Deviation from Trend
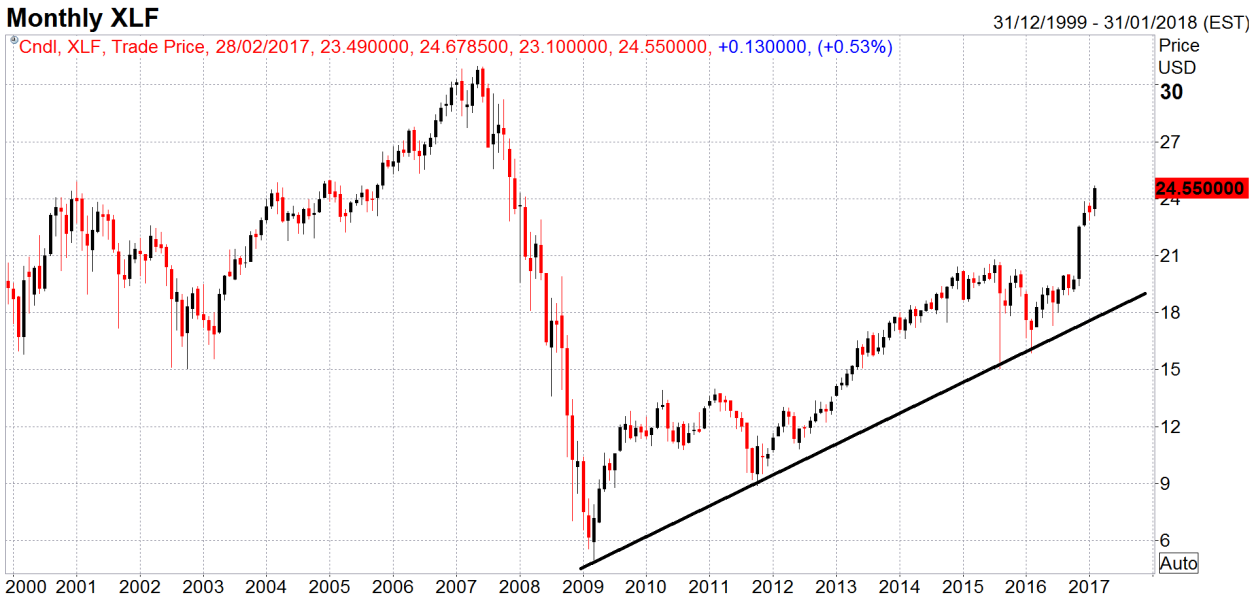
- Financials (via Financial Select Sector SPDR (NYSE:XLF)) look stretched vs the uptrend line (re-established after a minor bear market).
- Relative performance against the S&P 500 has peaked and compressed into a triangle.
- The monthly chart further highlights the extent to which financials have run vs their uptrend line. While not outright bearish, the risk of a pullback is elevated.
Overall Technical View: Bullish, but short-term risks are elevated given distance from trend.
3. Euro Stoxx – Broadening Top
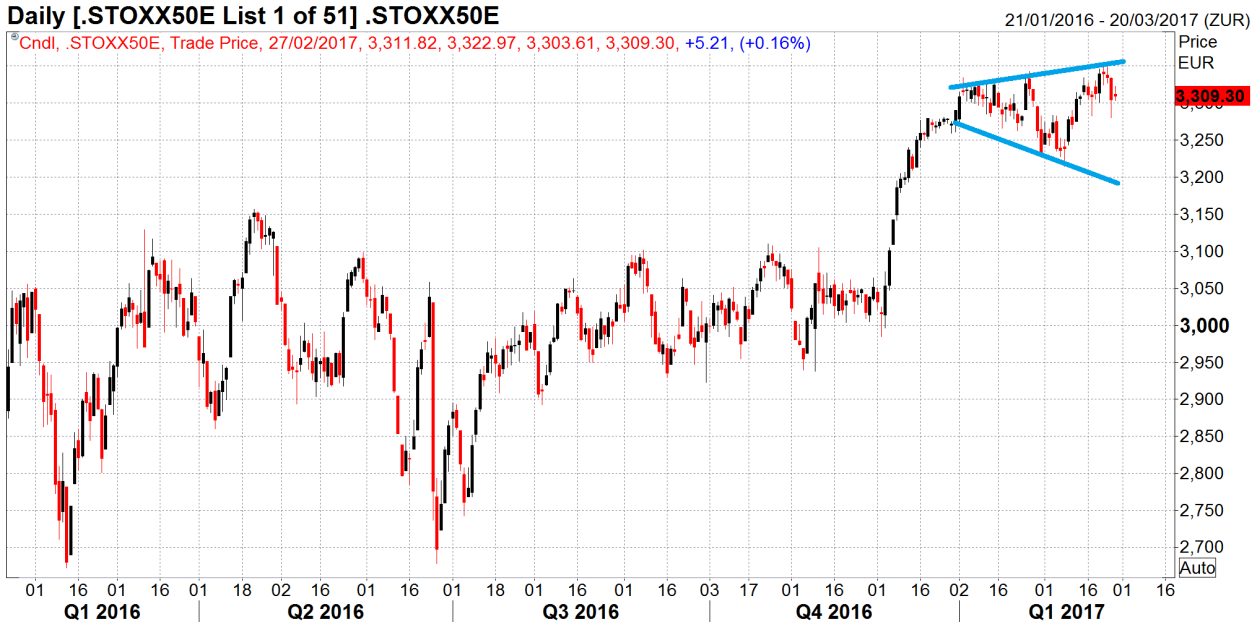
- Broadening top pattern raises the risk of seeing a short-term correction in Europe.
- At the same time, it presents useful trigger points for building or switching positions within the Euro Stoxx 50 i.e. a break of those trendlines will tend to see prices continue in the direction of the break.
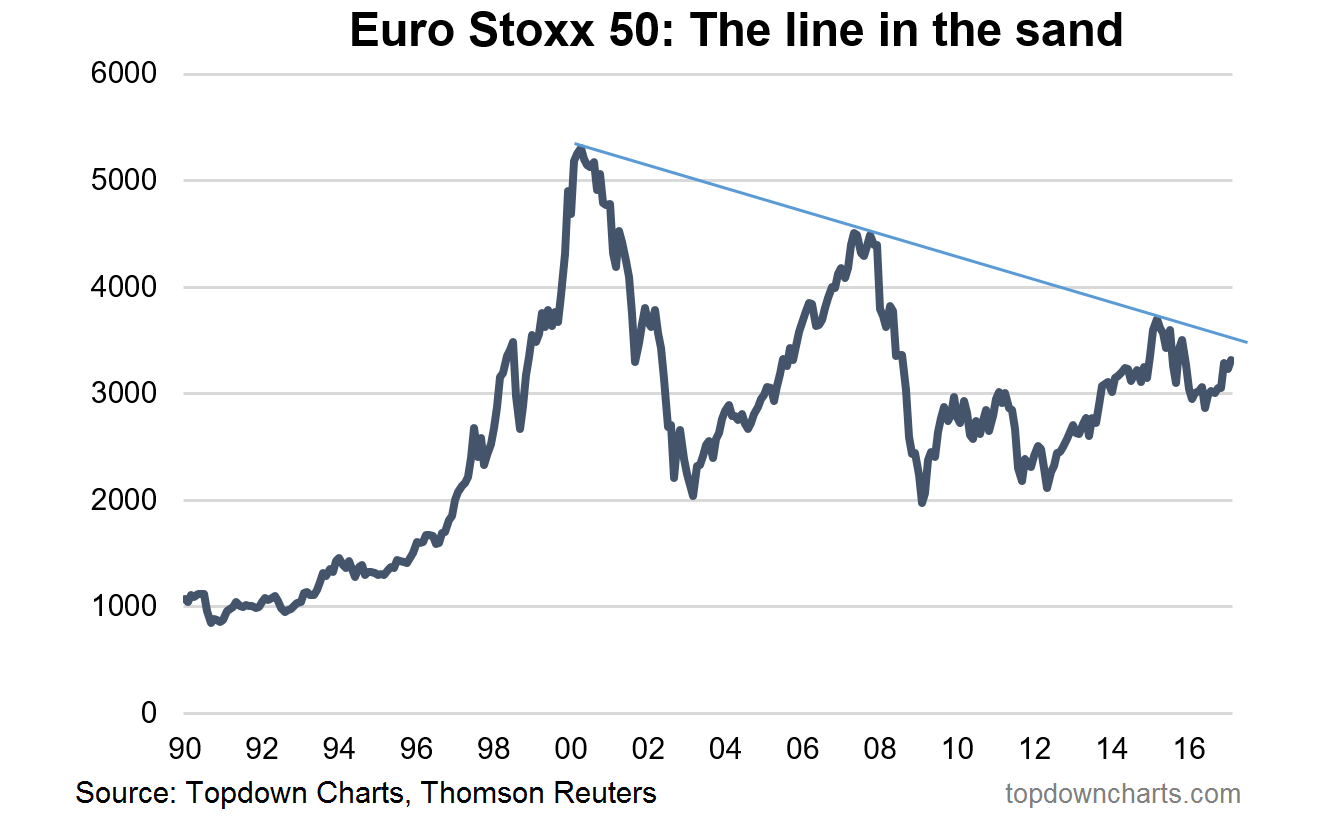
- Looking at the monthly chart we’re reminded that the Euro Stoxx Index still faces an important test in the form of a longer term down trend line.
Overall Technical View: Bearish bias given heightened near-term downside risks.
4. Gold – Overhead Resistance
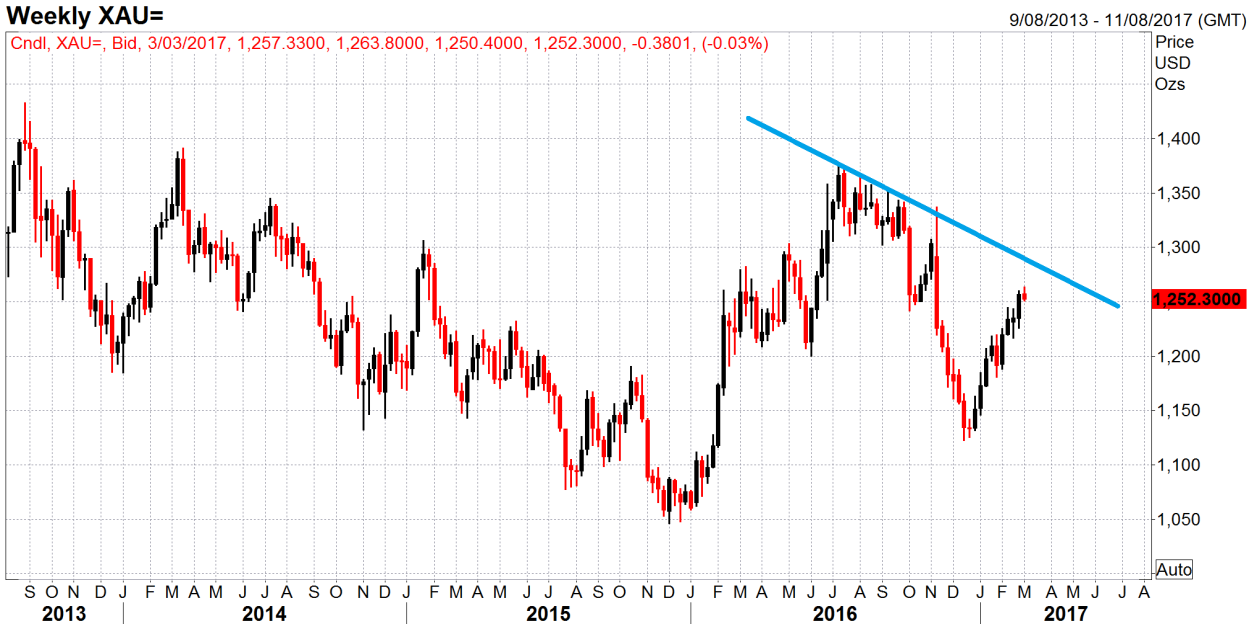
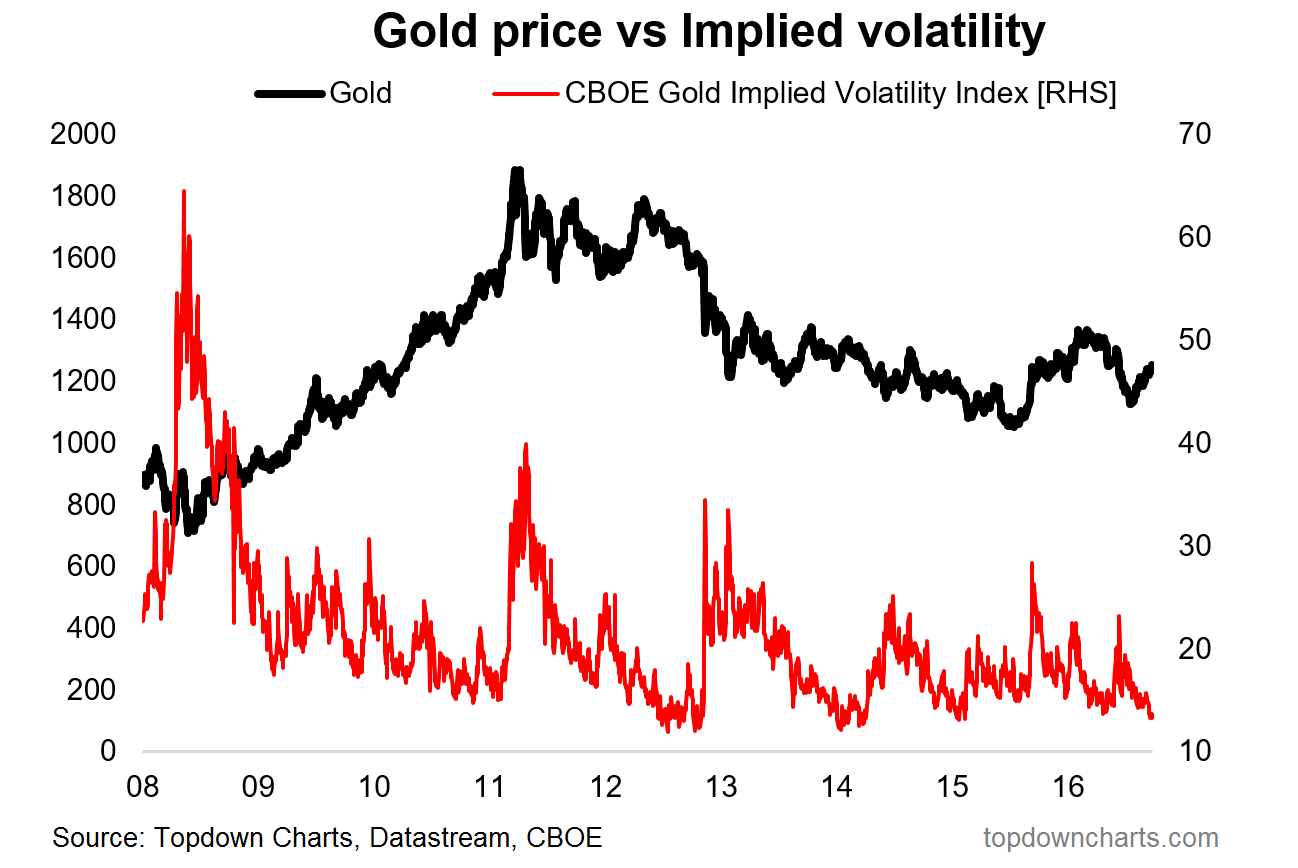
- Gold will soon be testing the short-term downtrend line and is also passing through a couple of zones of resistance.
- 1250 has been an important level and for now it is holding above that, the next important test will be 1300. Failure will mean a trip back to at least 1200 if not lower.
- The other signal comes from implied volatility, which has compressed to the lows and this is often a precursor of a big move, and often to the downside.
Overall Technical View: Cautious; upside break will be very bullish, but obstacles are evident.
5. Commodities – Familiar Signs…
- Commodities average net speculative futures positioning at a 12-year high.
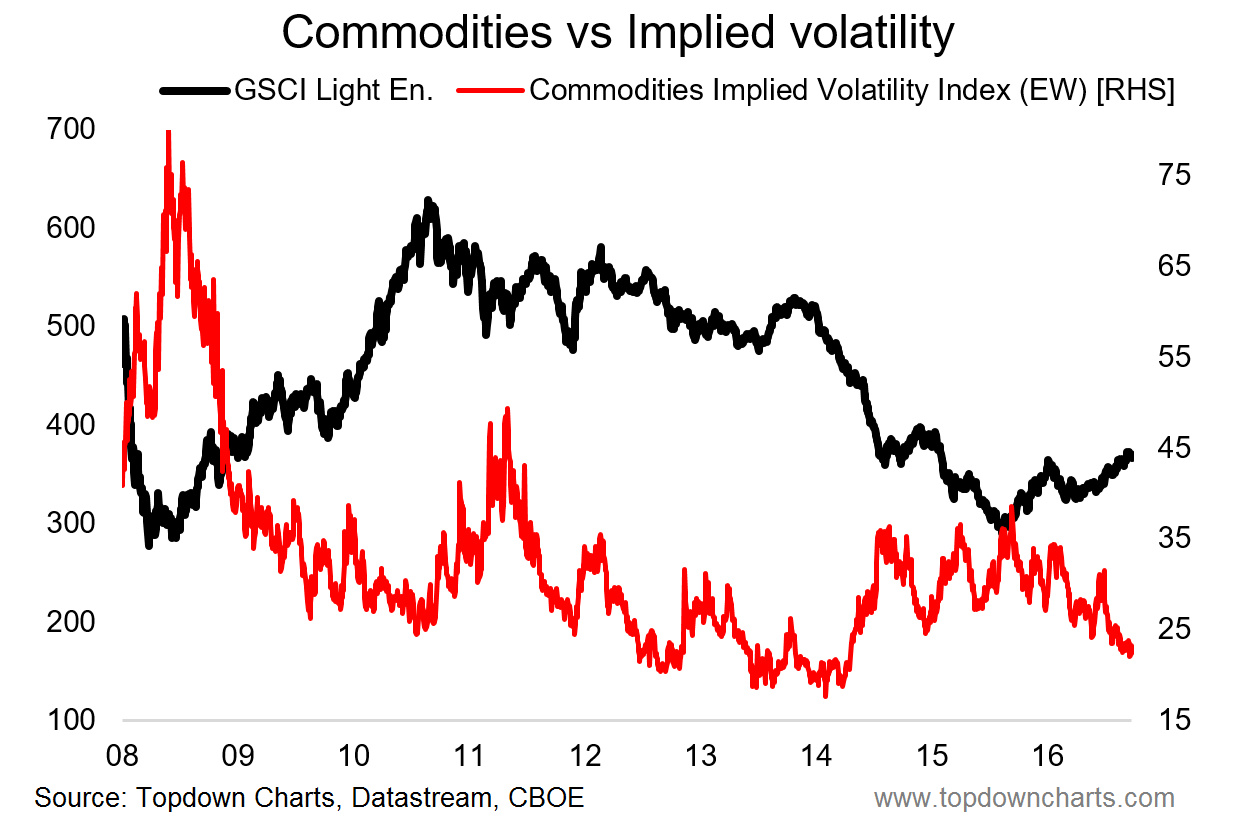
- Commodities average implied volatility close to a 30-month low.
- On both fronts these are signs of extreme optimism as well as complacency, and such conditions have often been found around short-term highs. But such patterns have also been seen before e.g. coming out of bear markets and into new bull markets.
Overall Technical View: Bullish strategic bias – looks like a new bull market.
Disclaimer: This report is intended for the specified recipient and may not be forwarded or duplicated without permission. This report is for informational and entertainment purposes only. Topdown Charts Limited (trading as Topdown Charts and Topdown Charts Institutional) is not a registered financial adviser and none of the content here should be construed as financial advice or an offer or solicitation for securities.
The content of this report is provided for informational purposes. The content is not intended to provide a sufficient basis on which to make an investment decision. It is intended only to provide observations and views of individual analysts and personnel of Topdown Charts. Observations and views expressed herein may be changed by the analyst at any time without notice. Past performance should not be taken as an indication or guarantee of future performance, and no representation or warranty, expressed or implied is made regarding future performance.
The content of this report has been obtained from or based upon sources believed by the analyst to be reliable, but each of the analysts and Topdown Charts does not represent or warrant its accuracy or completeness and is not responsible for losses or damages arising out of errors, omissions or changes in market factors. This material does not purport to contain all of the information that an interested party may desire and, in fact, provides only a limited view of a particular market.
