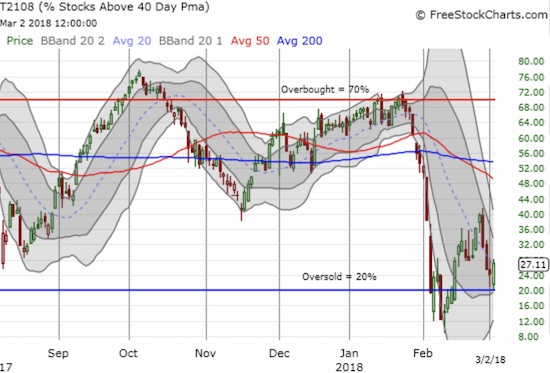
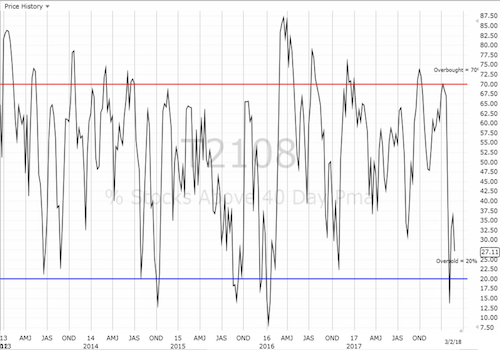
AT40 = 27.1% of stocks are trading above their respective 40-day moving averages (DMAs)
AT200 = 44.4% of stocks are trading above their respective 200DMAs
VIX = 19.6%
Short-term Trading Call: neutral (caveats below!)
Commentary
President Trump has been talking about taking unilateral trade actions since he was campaigning in 2016. The rhetoric heated up in the past year and took on even more solid form in recent weeks. For example, I benefited from recent trade war talk with a position in U.S. Steel (NYSE:X). So I was a bit surprised when the market reacted so negatively after Trump recently made the trade war even more real in recent tweets.
Then again, with European partners threatening retaliatory steps and Trump now responding in kind, I suppose the trade war tripwire has truly sprung into the market’s increasingly fragile conscious. Moreover, Trump tweeted that a trade war is both “good” and “easy to win” for America, so the threshold for the U.S. to enter into trade wars must be very low indeed!
The market’s reaction to the trade war fury demonstrates a lack of consensus on the implications. The selling on Thursday was swift and was strong enough to force a gap down on Friday. Yet buyers stepped into the breach and forced a relatively strong rally to close an otherwise dismal week.
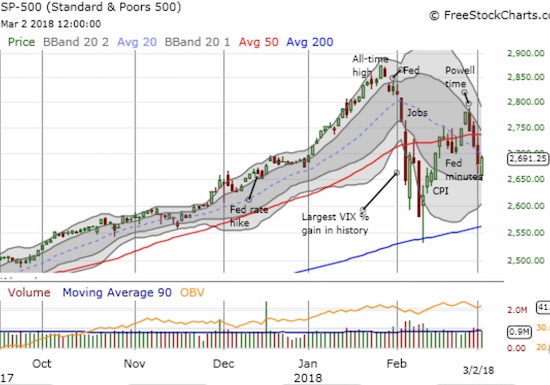
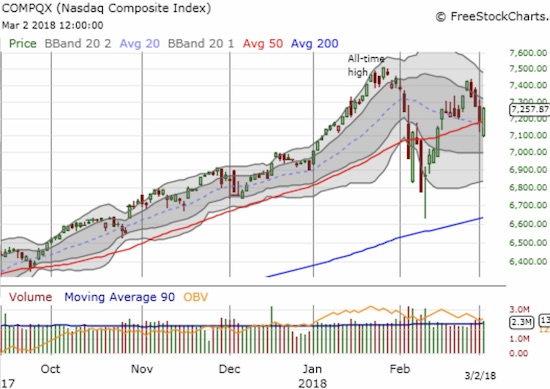
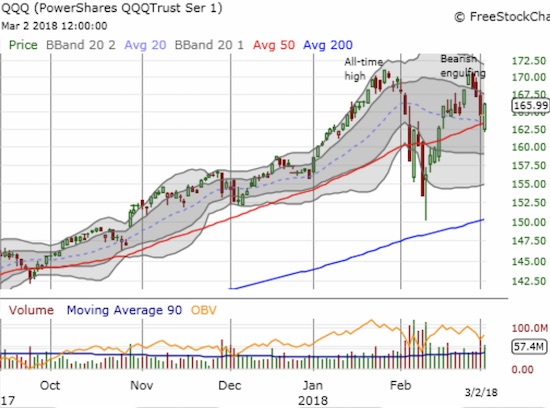
The S&P 500 (SPDR S&P 500 (NYSE:SPY)) gapped down and opened right at the previous day’s intraday low. The subsequent buying was critical because the opening gap down forced the NASDAQ and the PowerShares QQQ ETF (NASDAQ:QQQ) below their respective 50-day moving averages (DMAs). At the close, the tech-laden indices were once again above their 50DMAs with solid gains of 1.1% and 0.9% respectively. The S&P 500 closed with a gain of just 0.5% and failed to break its downtrending 20DMA.
The S&P 500 (SPY) gapped down but managed to gain 0.5% before stopping short at its downtrending 20DMA.
The NASDAQ managed a bullish comeback by surging from its 50DMA breakdown to finish the day with a 1.1% gain that almost reversed all the previous day’s loss.
The PowerShares QQQ ETF (QQQ) mounted a less dramatic comeback from its 50DMA breakdown with a 0.9% gain.
The iShares Russell 2000 ETF (NYSE:IWM) made an even more dramatic comeback that produced a 1.6% gain on the day. IWM punched through its downtrending 20DMA but still closed below its 50DMA.
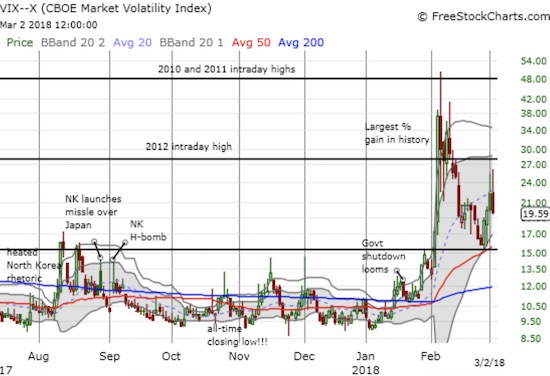
The dramatic market comeback had a dramatic impact on the volatility index, the VIX. The fear gauge was up as much as 16.7% at its peak. At the close, the VIX suffered a 12.8% loss. The VIX closed at its low and even below the previous day’s intraday low. This was a significant implosion, but I am still eyeing an eventual drop below the 15.35 pivot.
The rally in the volatility index (VIX) stopped short of the 2012 intraday high before imploding.
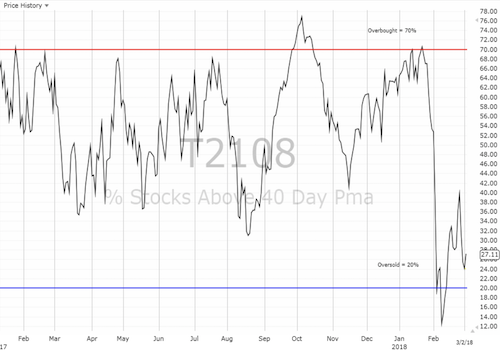
At its low, AT40 (T2108) traded right to the edge of oversold conditions (19.97% to be exact) before rebounding. You just can’t make this stuff up! My favorite technical indicator ended the day at 27.1%.
AT40 (T2108) performed a picture-perfect bounce off the oversold threshold.
The divergent performances are opening up a wide array of trading opportunities on both the long and short side. The on-going drip of challenging news is throwing previous trading and investing strategies for loops and motivating some over-reactions and trigger-finger responses. The heightened uncertainty generated by the potential for a trade war makes my neutral trading call appear even more appropriate.
On the bearish side, I will be looking to see whether buyers exhausted themselves with the extended intraday rally off the lows. My eyes will be on the tech stocks in this case. On the bullish side, the bounce off the oversold threshold could represent the latest tradable bottom. An S&P 500 close above its 50DMA would confirm this bottom.
CHART REVIEWS
Caterpillar (NYSE:CAT)
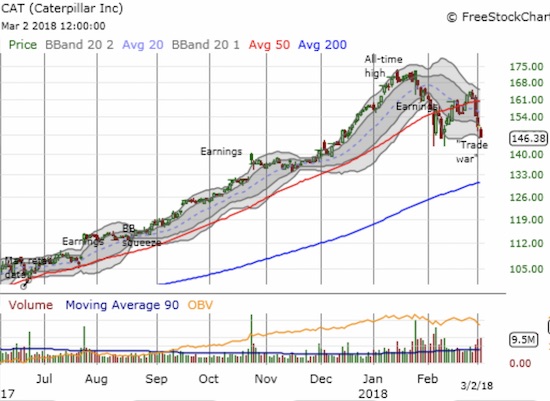
As planned, I locked in profits on my CAT put on Thursday, but I could have waited another day. With talk of trade war in the air, CAT continued its tumble. CAT gets the pleasure of a double whammy from a trade war through higher steel costs and potentially lower access to international markets, especially China. The stock lost another 2.6% and matched its February low. I daresay 200DMA support is in play for CAT here. Accordingly, I need to get right back into put options on CAT. Unless AT40 is in oversold conditions, I will get aggressively bearish on CAT if it closes lower…which I think is very likely. I may even just sit on short shares.
Caterpillar (CAT) is on the edge of a very bearish confirmation of its 50DMA breakdown.
McDonalds (NYSE:MCD)
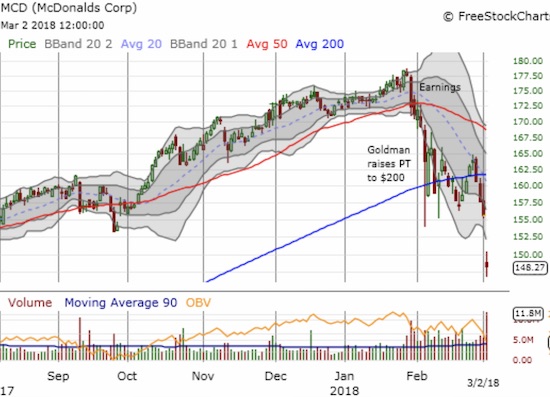
Could MCD become a trade war victim? Will residents of other countries boycott their local McDs to make a point about trade policy? If so, that scenario could explain MCD’s 4.8% gap down and loss or at least explain the over-reaction to a downgrade by RBC Capital Market that lowered its price target from $190 to $170, still well above Thursday’s close.
Now trading at a 9-month low, MCD is technically a broken stock that confirmed 200DMA resistance. Notice in the chart below that MCD was a reluctant participant in the earlier bounce from oversold conditions. For part of the market rally, MCD was selling its way into a fresh 200DMA breakdown. So MCD was in trouble before the trade war rhetoric heated up. I want to load up the truck on MCDs, but under these circumstances I will exercise a LOT of patience.
McDonalds (MCD) is a a broken stock given its confirmed 200DMA breakdown.
Australian dollar versus Japanese yen (AUD/JPY)
I am now watching the Japanese yen, and especially AUD/JPY, on an on-going basis. While the stock market bounced back from early losses, the Japanese yen pairs also bounced off lows of the day. This correlation is not an accident given the amount angst coursing through the market’s veins. The bounce for USD/JPY avoided a fresh 16-month closing low. The bounce in AUD/JPY just barely averted a fresh 16-month intraday low. I went into the weekend taking profits on all my long yen positions. I will look to the next bounce in in yen currency pairs.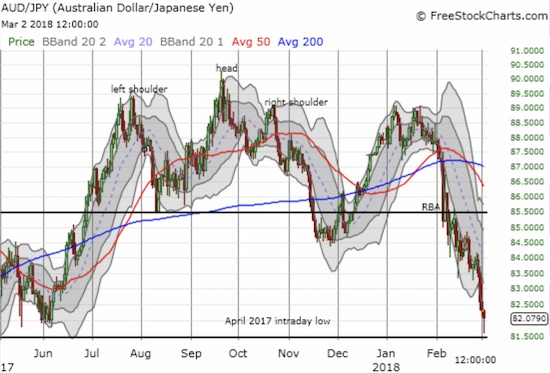
AUD/JPY is teetering on a freshly bearish breakdown as the Japanese yen’s strength continues nearly unabated.
Black line: AT40 (T2108) (% measured on the right)
Red line: Overbought threshold (70%); Blue line: Oversold threshold (20%)
Be careful out there!
Full disclosure: short VXX, long UVXY calls, long SPY call, long CAT call

