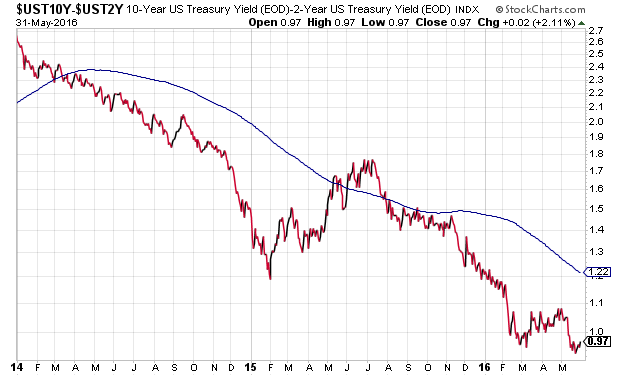
How dependent is the U.S. economy on stimulus by the central bank of the United States? Take a look at what has happened in the bond market since the Federal Reserve began to reduce asset purchases as part of its quantitative easing program (“QE3″) in 2014. The spread between longer-term maturity treasuries and shorter-term maturity treasuries has narrowed dramatically.

The two-and-a-half year downtrend demonstrates a phenomenon called “yield curve flattening.” And it is warning that the Fed’s halfhearted attempts to slowly remove economic stimulus could result in stagnation or recession.
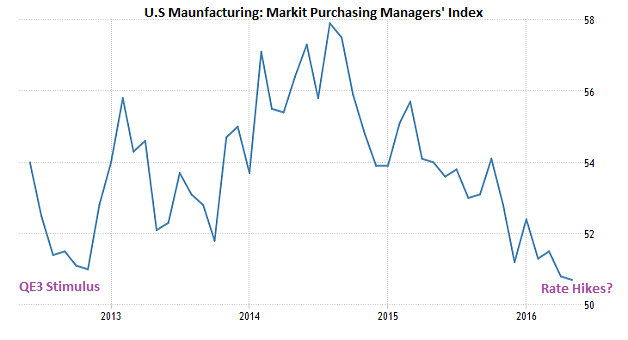
To be frank, some parts of the U.S. economy are already stagnant. Manufacturing has been free-falling for two years due to the global economic slowdown. Markit, the financial information provider, explained that the ongoing deterioration of manufacturing output is not going to bolster any warm-n-fuzzy feelings for those who might have been hoping for domestic economic resilience.
The reality on the manufacturing element of the U.S. economy is relatively straightforward. When the Federal Reserve actively expanded its balance sheet (via QE3) in its effort to ward off recessionary pressure in 2012, the U.S. economy responded favorably. During the central bank’s drawn-out stimulus reduction in 2014, however, manufacturing peaked and subsequently began to weaken.
In fact, things got worse for manufacturers. The Fed eventually stopped its asset purchases altogether in the 4th quarter of 2014; it later raised its overnight lending rate by a negligible 0.25% in the 4th quarter of 2015. And now it is strongly considering another bump higher here in the summer of 2016. As modest as these “tightening” moves have been, the policy direction eventually created a lifeless environment for U.S. manufacturers, miners and gas providers.
There’s little question that the investment community has taken notice of the relationship between manufacturing and central-bank stimulus removal. Yield spreads between longer-term 10-year treasury bonds and shorter-term treasury bonds chimed in at more than 2.5% at the beginning of 2014. Back then, one received 2.5% more per year in interest payments by allocating money to a 10-year maturity rather than a 2-year maturity. That was a confidence-inspiring spread in the world of U.S. sovereign debt. Today? You’re going to get less than 1% (0.97) more in interest payment for the same decision. In fact, you’re going to get roughly 1.85% annually for a 10-year, which is significantly less than the spread between “10s” and “2s” just two-and-a-half years ago.
The actuality that scores of investors have been demanding longer-term treasuries in assets like iShares 7-10 Year Treasury (NYSE:IEF) and iShares 20+ Year Treasury (NYSE:TLT) for roughly two-and-a-half years is a sign that they are worried about the domestic economy. And that runs completely counter to the “happy talk” out of the mouths of Federal Reserve leaders who have attempted to paint the U.S. economic backdrop in a favorable light.
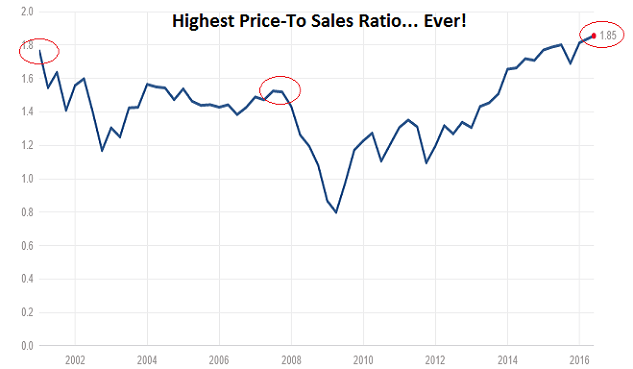
For example, they believe that the downturn in industrial production is transitory. Really? Two-and-a-half years of transitory weakness? We have already witnessed how the manufacturing downturn has devastated the revenue of S&P 500 companies. Half of them generate sales from overseas operations, which is why S&P 500 revenue has fallen for five consecutive quarters. Count ’em… five consecutive quarters! This is the reason that stock valuations as measured by price-to-sales (P/S) have never been this overpriced in the history of the metric. (And that includes the dot-com insanity of 2000!)
The bond market as well as the manufacturing environment may not be the only signs of economic fragility. The Conference Board, a global researcher provider, revealed the latest data on consumer confidence. The Consumer Confidence Index hit 92.6, its lowest level since November. Meanwhile, the Future Expectations Index declined to its lowest level (79.0) in approximately two-and-a-half years.
There it is again… the two-and-a-half year mark. The same time horizon for consumers' fear about the future of the economy corresponds to bond-investor concerns about the economy as demonstrated in the flattening of the treasury bond yield curve.
Obviously, stocks have been relatively resilient in spite of the evidence. The S&P 500 is within spitting distance of all-time record highs.
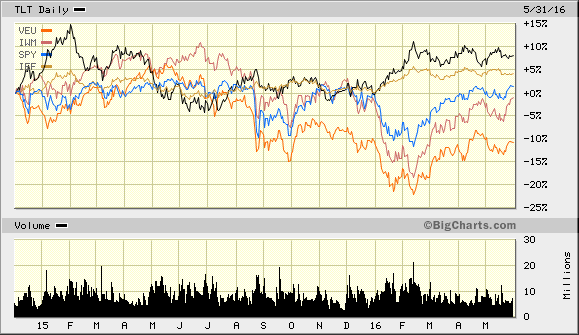
Nevertheless, even stock investors need to be cognizant of the struggles for stocks relative to bonds. Compare the aforementioned bond proxies IEF and TLT to exchange-traded dynamos like S&P 500 SPDR Trust (NYSE:SPY), iShares Russell 2000 (NYSE:IWM) and Vanguard All World (NYSE:VEU). “Risk off” treasuries have outperformed diversified large-cap, small-cap and foreign equities for 18 months already. What’s more, stocks collectively lost value in the time frame.
Could things get a whole lot better for stock assets? Not unless the yield curve spread begins to widen in earnest. Keep in mind, the weekly yield curve spread is highly correlated with the year-over-year growth rates for S&P 500 forward earnings and forward sales. If the yield curve continues its flattening trend, then, you could just about bank on ongoing profit deterioration and ongoing revenue declines.
Pay attention to the trend of the treasury bond yield curve, whether it is flattening or widening. It can give you insight about the economy’s health. What’s more, it is likely to give you a “heads up” about the near-term well-being of popular stock asset benchmarks.


