Euro bounces off support, short squeeze on bears as Draghi disappoints
 Source: Short Side of Long
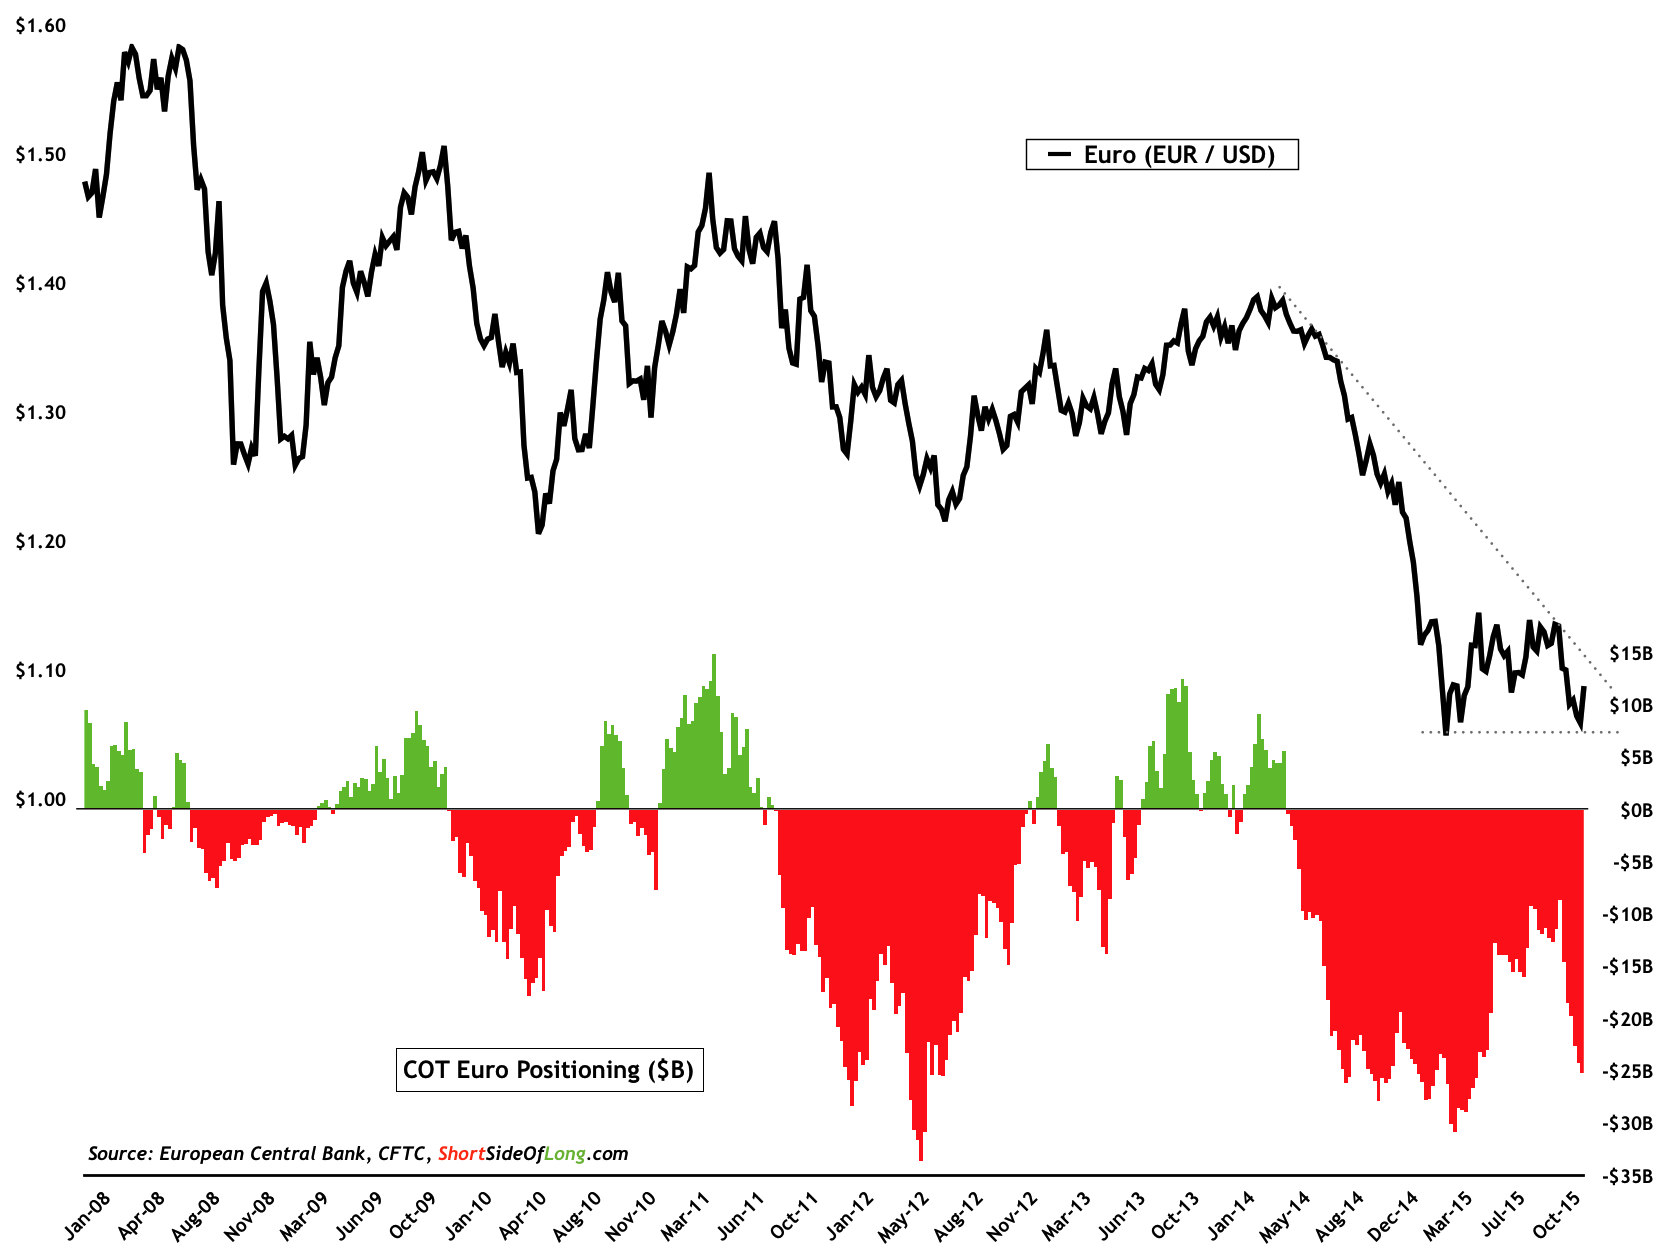
Despite pushing ECB’s monetary policy further into dovish territory, it seems that Mario Draghi has disappointed overly ambitions speculators, who have been betting on a bazooka styled stimulus from the European Central Bank president. Within seconds of the new monetary policy announcement, the euro shot up together with interest rates while the DAX 30 suffered a strong sell off.
As mentioned in the previous article on our blog, investors were uniformly positioned towards further dollar application and as we here at Short Side of Long always say “when its obvious to the public, its obviously wrong.” European euro exchange rate bounced sharply against the US dollar from its technical support around $1.05 and rallied almost 500 pips within an hour and half. This will clearly hurt hedge funds and other speculators who held almost 25 billion dollar net short position heading into Thursday's ECB meeting.
US long term interest rates are moving towards an inflection point
 Source: Short Side of Long
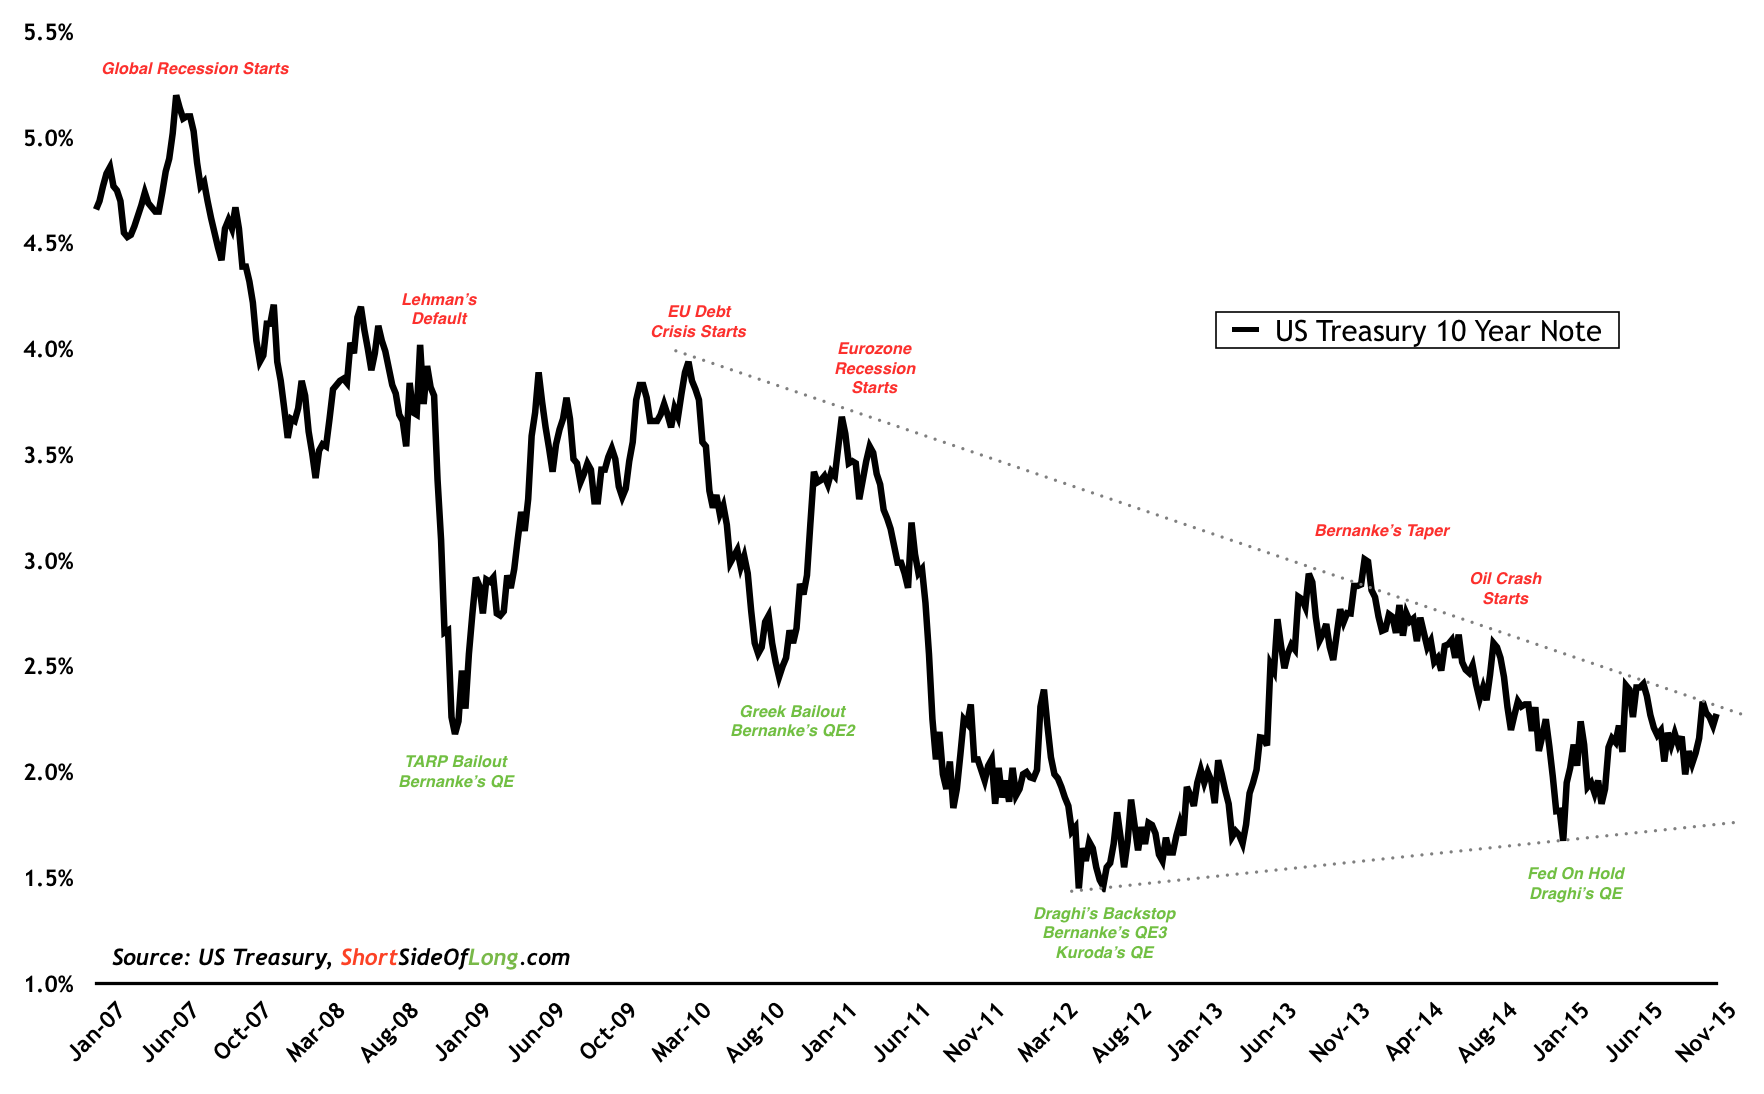
US 10 Year Treasury yields also shot up rather swiftly on the announcement, but managed to react back some of that movement the following day during Non Farm Payrolls announcement. Quite a lot of volatility in the recent days, that is for sure. There is now an interesting technical picture in development for the long term Treasury bond market, with bulls creating higher lows and bears lower highs in the yields. This triangulation is clearly leading us towards an inflection point. While we cannot be 100% certain, the current tape behaviour is signalling that interest rates want to move higher. We will be keeping a close eye open the 10 Year Note and watching for any signs of a break out in yields above the 2.35% or 2.40% area.
Percentage of NYSE 52 week new lows is once again on the rise
 Source: Short Side of Long
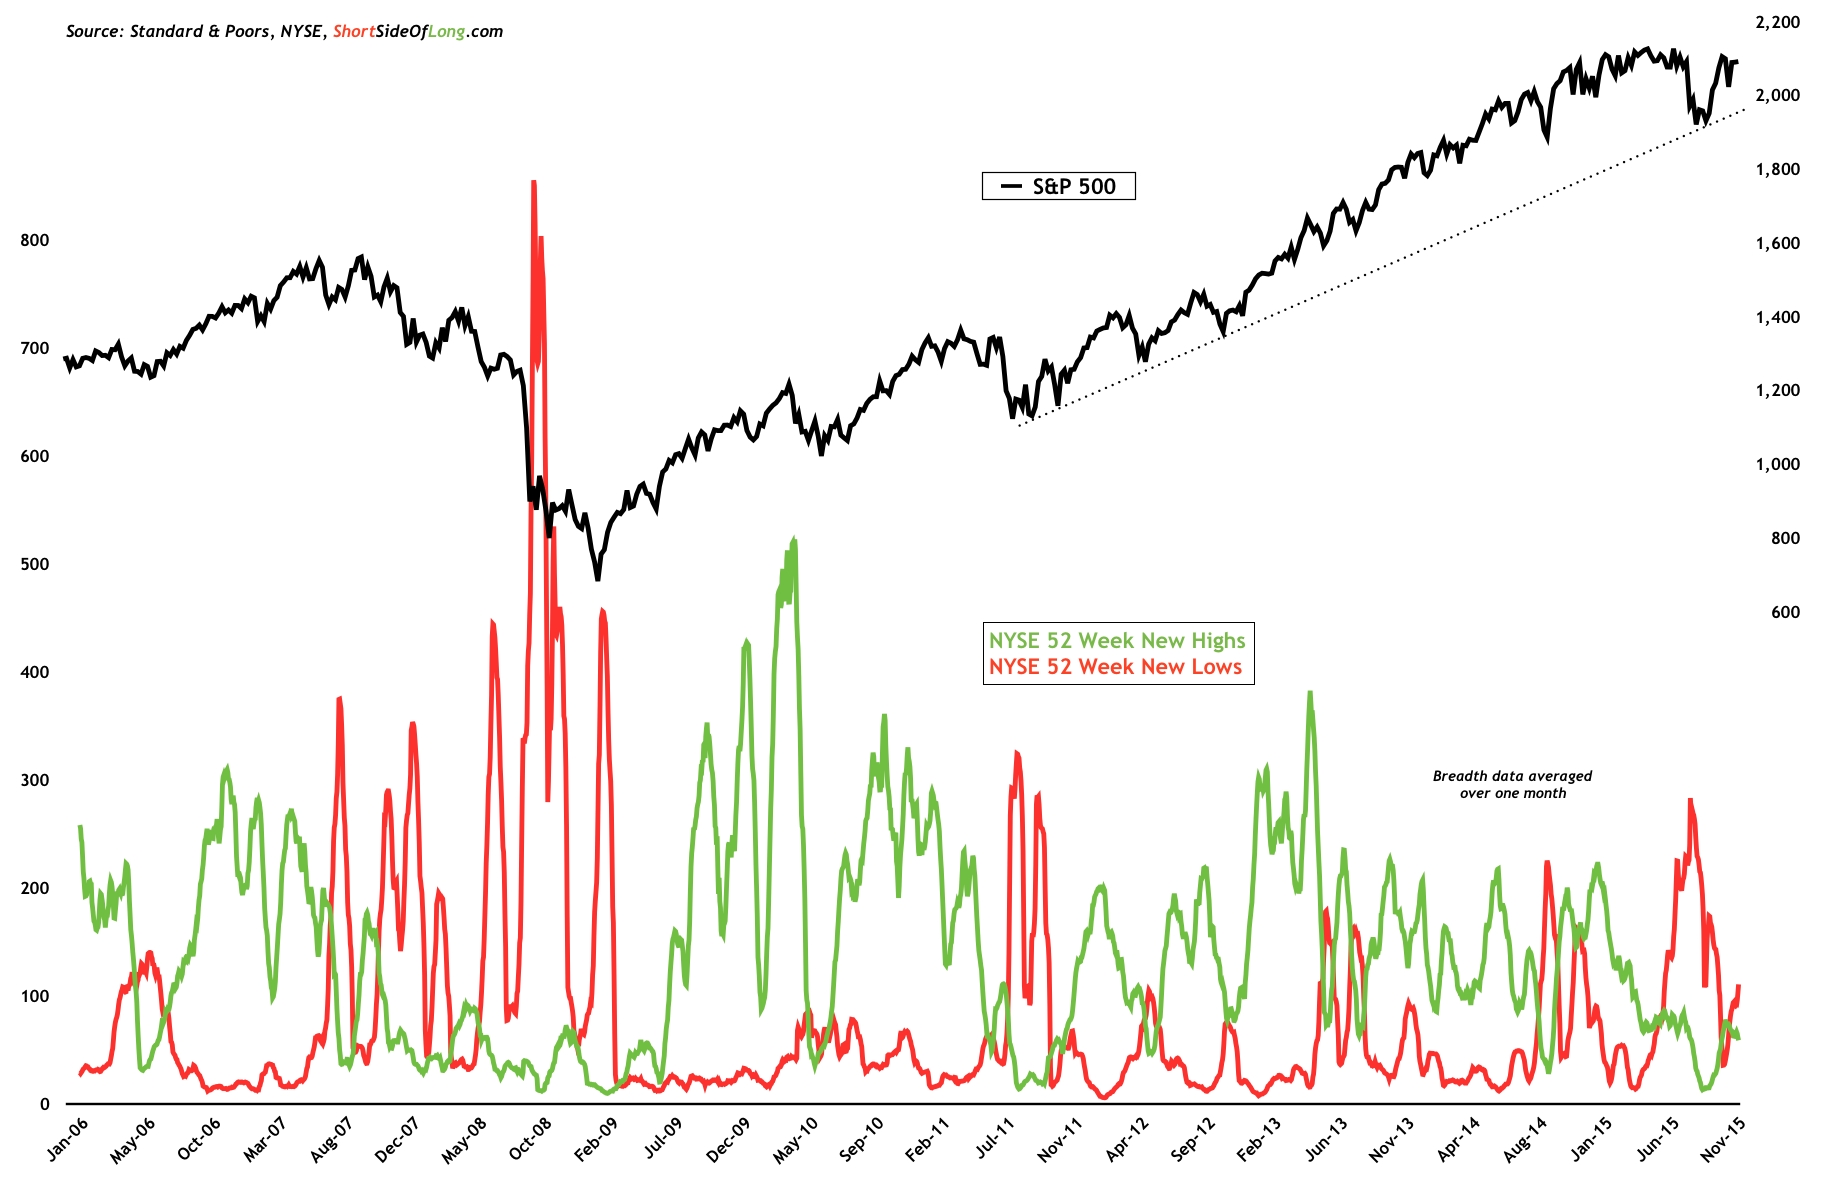
Meanwhile, despite the strength in the US stock market, majority of the global equities still remain under pressure. Even within the US, breadth is quite narrow and when averaged over 21 business days, NY stock exchange is experiencing a lot more 52 week new lows relative to 52 week new highs. And yes, this is despite S&P 500 sitting at 2,091 points, which is about 2% away from a new record high. Majority of the new lows continue to be dominated by the energy sector.
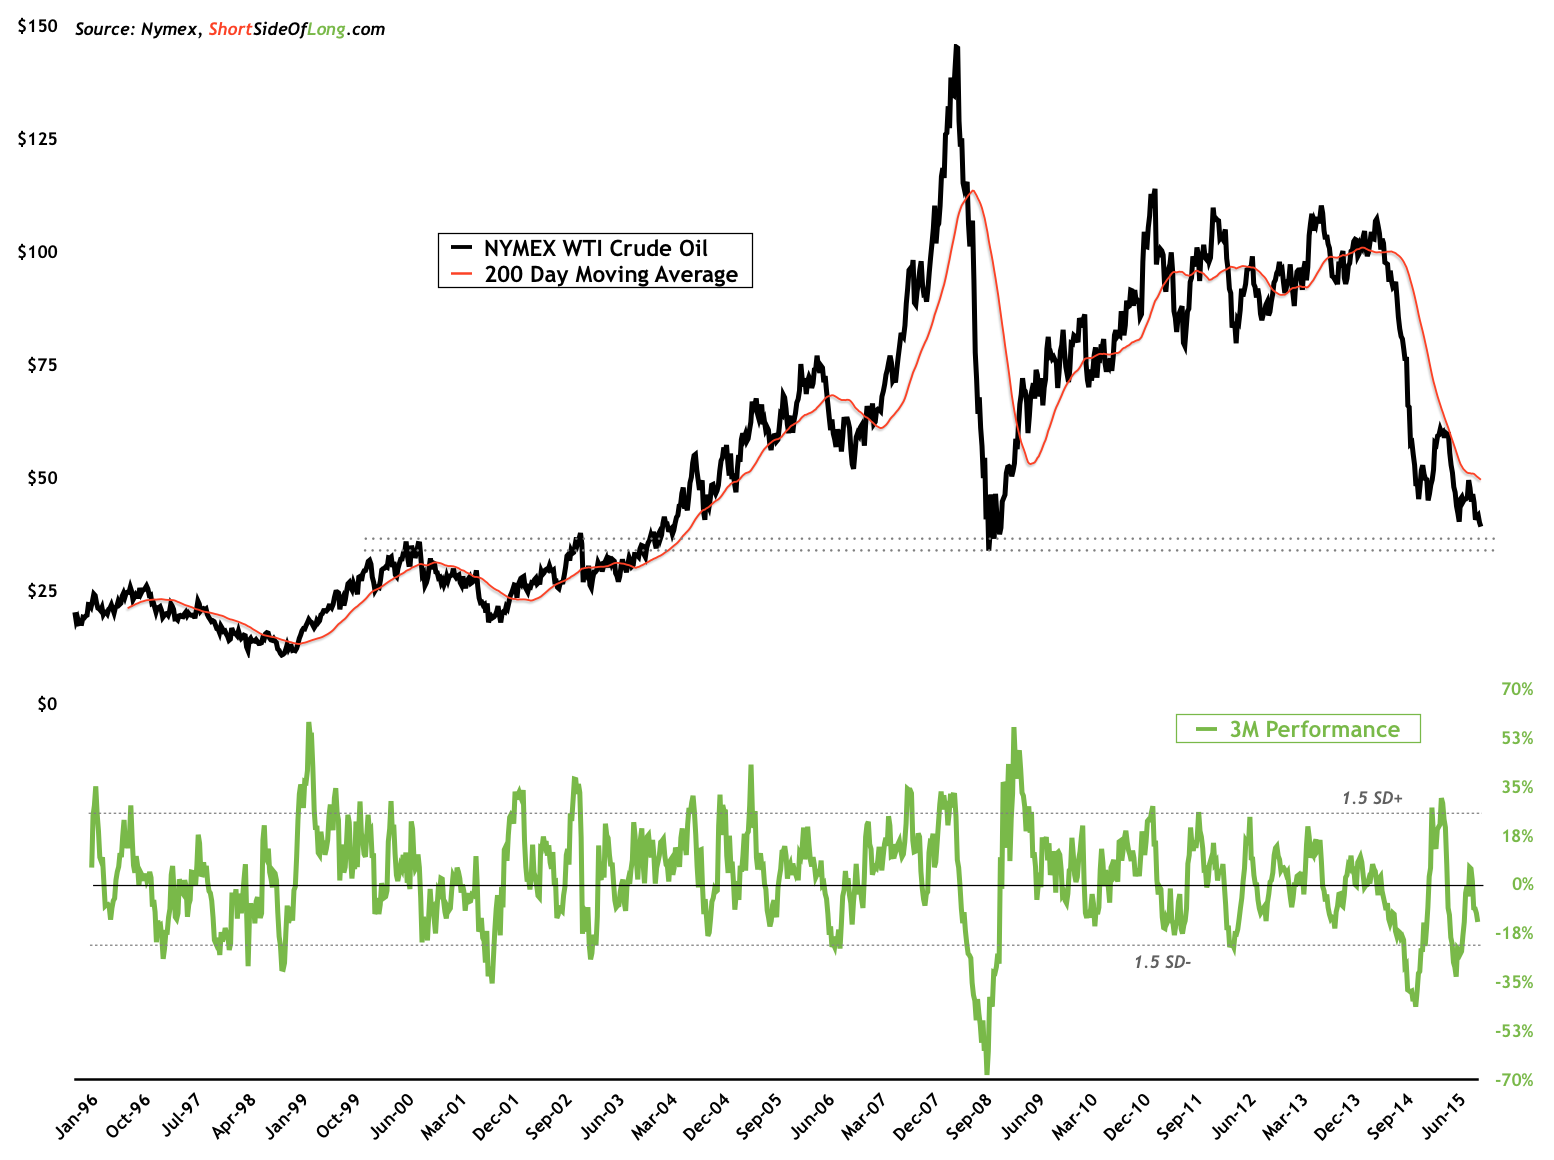
OPEC’s meeting in Vienna on Friday disappointed bullish oil speculators who have been expecting the cartel to cut production in an effort to stabilise prices and relieve the pain pressure oil producing countries are currently experiencing. Since Saudi Arabia is the only OPEC producer with over 10 million barrel per day, that can come close to matching the production of Russia and the United States, the strategy seems to be all out “pump and dump” to retain the market share. Oversupply continues to pressure prices in the short term, pushing crude oil WTI spot contract ever closer towards the all important $37 to $38 multi-decade support level.
OPEC disappoints oil speculators, sell off approaching a major support
 Source: Short Side of Long
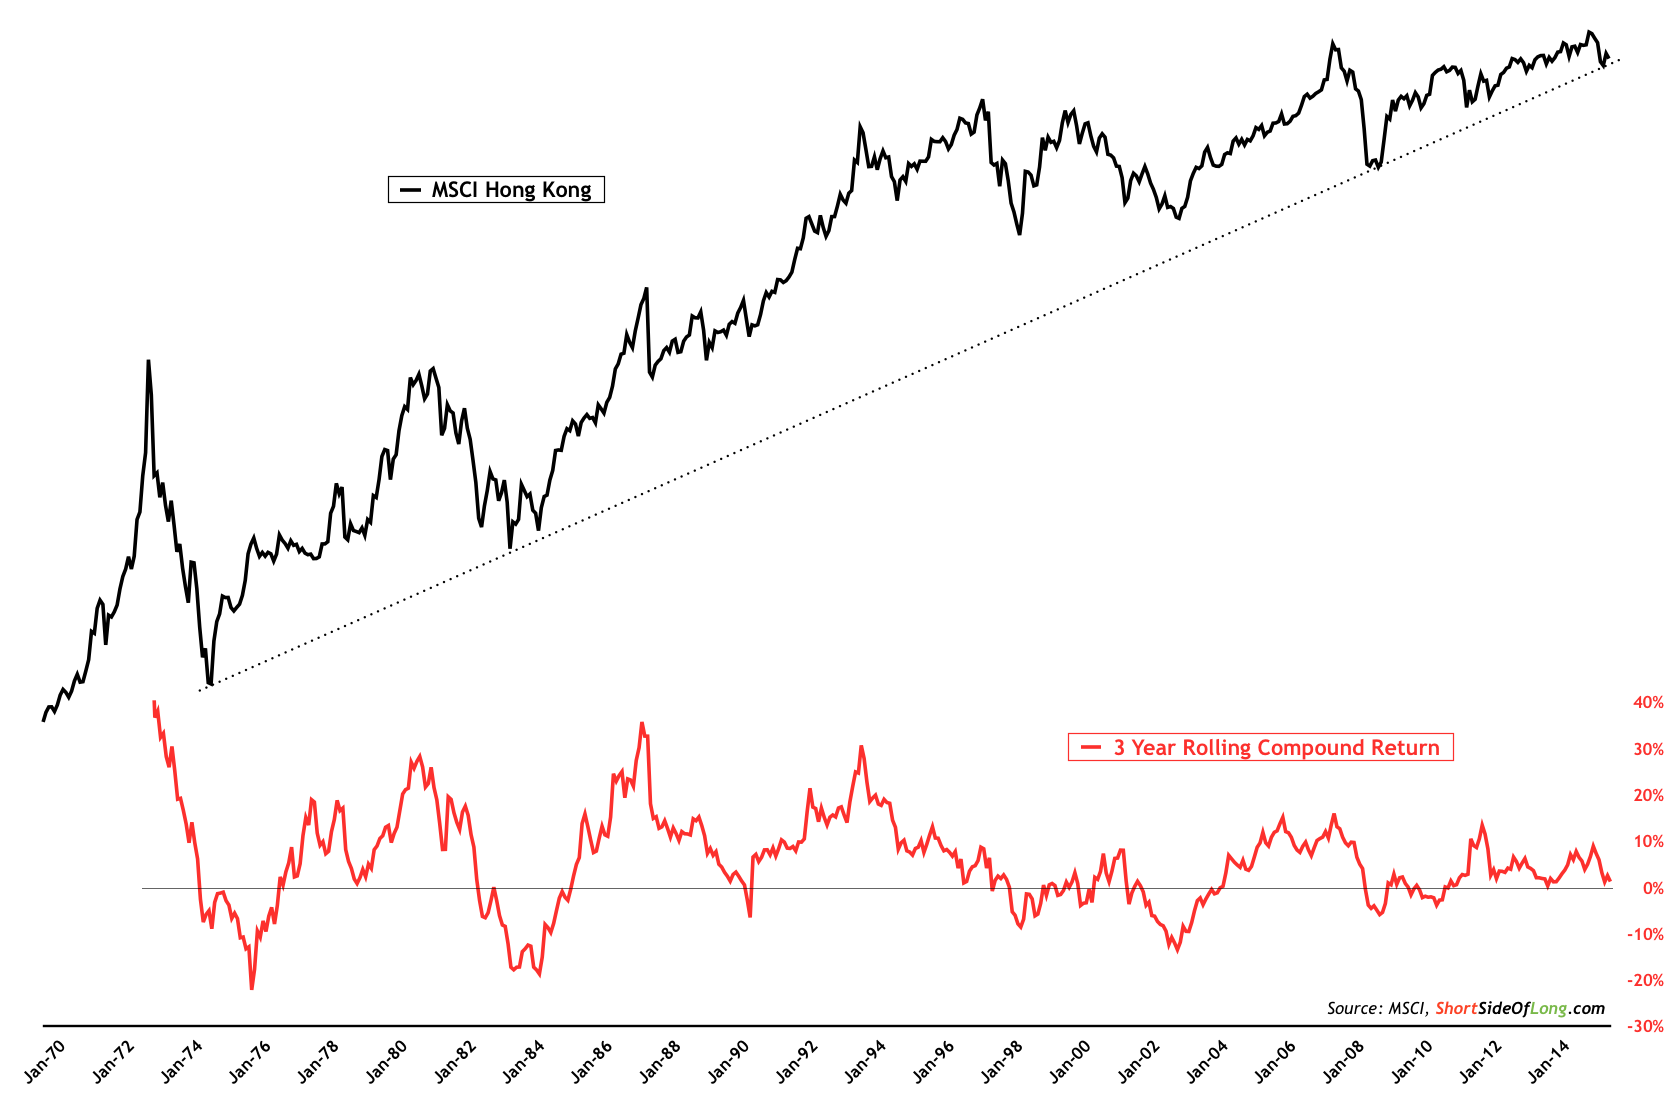
Speaking of multi-decade support levels, the final chart of interest for the blog readers today is the MSCI Hong Kong stock market (not adjusted for dividends). The price of the index finds itself on a very important long dated uptrend line, which has supported HK stocks during the early 1980s bust and well as the more recent 2008 Global Financial Crisis. It remains to be seen whether this city state can properly bounce of this support in coming months and quarters ahead. As a final observation, Hong Kong equities aren’t that much higher relative to the period in 1996, just before the Asian Financial Crisis. Despite many rallies and sell offs, the stock market has mainly moved sideways for almost two decades now. This will be even more true if the price breaks lower from the current critical support in the chart below.
MSCI Hong Kong index finds itself testing a major multi-decade trend line
 Source: Short Side of Long
